


Visualizing Iceland's Vegetation
This post describes the data and technology behind our NDVI Viewer, which you can view here. The source code is available on Github.
Introduction
Remote sensing data and remote sensing derived products are starting to become ubiquitous in our daily lives. From the maps that navigate us, to tracking dangerous weather events, they have the potential to improve and save lives. However, the quantity and format of these data can make interpretation and use difficult.
Here at Visual Perspective we spend a lot of time thinking about how to process and visualize large geospatial datasets. A recent paper in the Remote Sensing journal, “Warming, Sheep and Volcanoes: Land Cover Changes in Iceland Evident in Satellite NDVI Trends,” got us thinking about the visualization of a data product we have frequently used throughout our careers: NDVI or the Normalized Difference Vegetation Index. Before we discuss this paper and our work, it’s important to understand what NDVI is and where it comes from.
What is NDVI?
Live, green, healthy vegetation absorbs energy from the sun in a spectral region called the Photosynthetically Active Radiation (PAR) region. Plants use the sun’s energy in this particular spectral region to drive photosynthesis and make food. But not all of the sun’s emitted energy spectrum is useful for plants. The sun’s radiation in near-infrared region doesn’t have the required energy to help plants synthesize organic molecules. Therefore plants have evolved to re-emit radiation in the near-infrared region.
So we know plants like to absorb energy in one spectral region (PAR) and to reflect in another spectral region (near-infrared). In the PAR spectral regions, plants appear dark because they are absorbing the energy, and in the near-infrared they appear bright because they are reflecting energy. We can construct an index to take advantage of these properties. This index effectively measures the ratio in absorption between the visible and the near-infrared regions. Donald Deering and Robert Hass, along with John Schell, developed the concept of NDVI:

This is the near-infrared radiation, minus visible radiation, divided by near-infrared radiation, plus visible radiation. With this type of formulation, NDVI will have the range of values between -1 and +1. A value of 0 indicates no vegetation, while a value close to 1 indicates the highest possible density of green leaves.
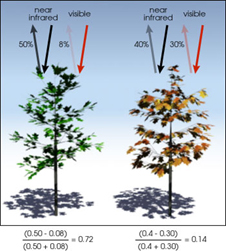
Robert Simmon from NASA created a very helpful graphic (Figure 1) demonstrating the difference in NDVI between healthy and unhealthy vegetation. Healthy vegetation (left on Figure 1) absorbs most of the visible light that hits it, and reflects a large portion of the near-infrared light, yielding a relatively higher NDVI. Unhealthy or sparse vegetation (right on Figure 1) reflects more visible light and less near-infrared light, yielding a relatively lower NDVI.
What is NDVI Used For?
Since NDVI directly measures the health and presence of vegetation, it has signficant application in the farming sector. It is currently used to track crop health and stress (Barnes et al. 2000), allowing farmers to identify stressed crops weeks before being detectable by the human eye. In addition, NDVI can be used to predict crop yields months before harvest (Panda et al. 2000; Quarmby et al. 1993).
In addition to direct agricultural monitoring, NDVI has a variety of interesting secondary applications. These include monitoring drought and soil moisture (Gu et al. 2008; Rulinda et al. 2012), migration patterns and survival rates of animals (Szép et al. 2006), and the impact of urbanization (Imhoff et al. 2000).
Visual Perspective's NDVI Viewer
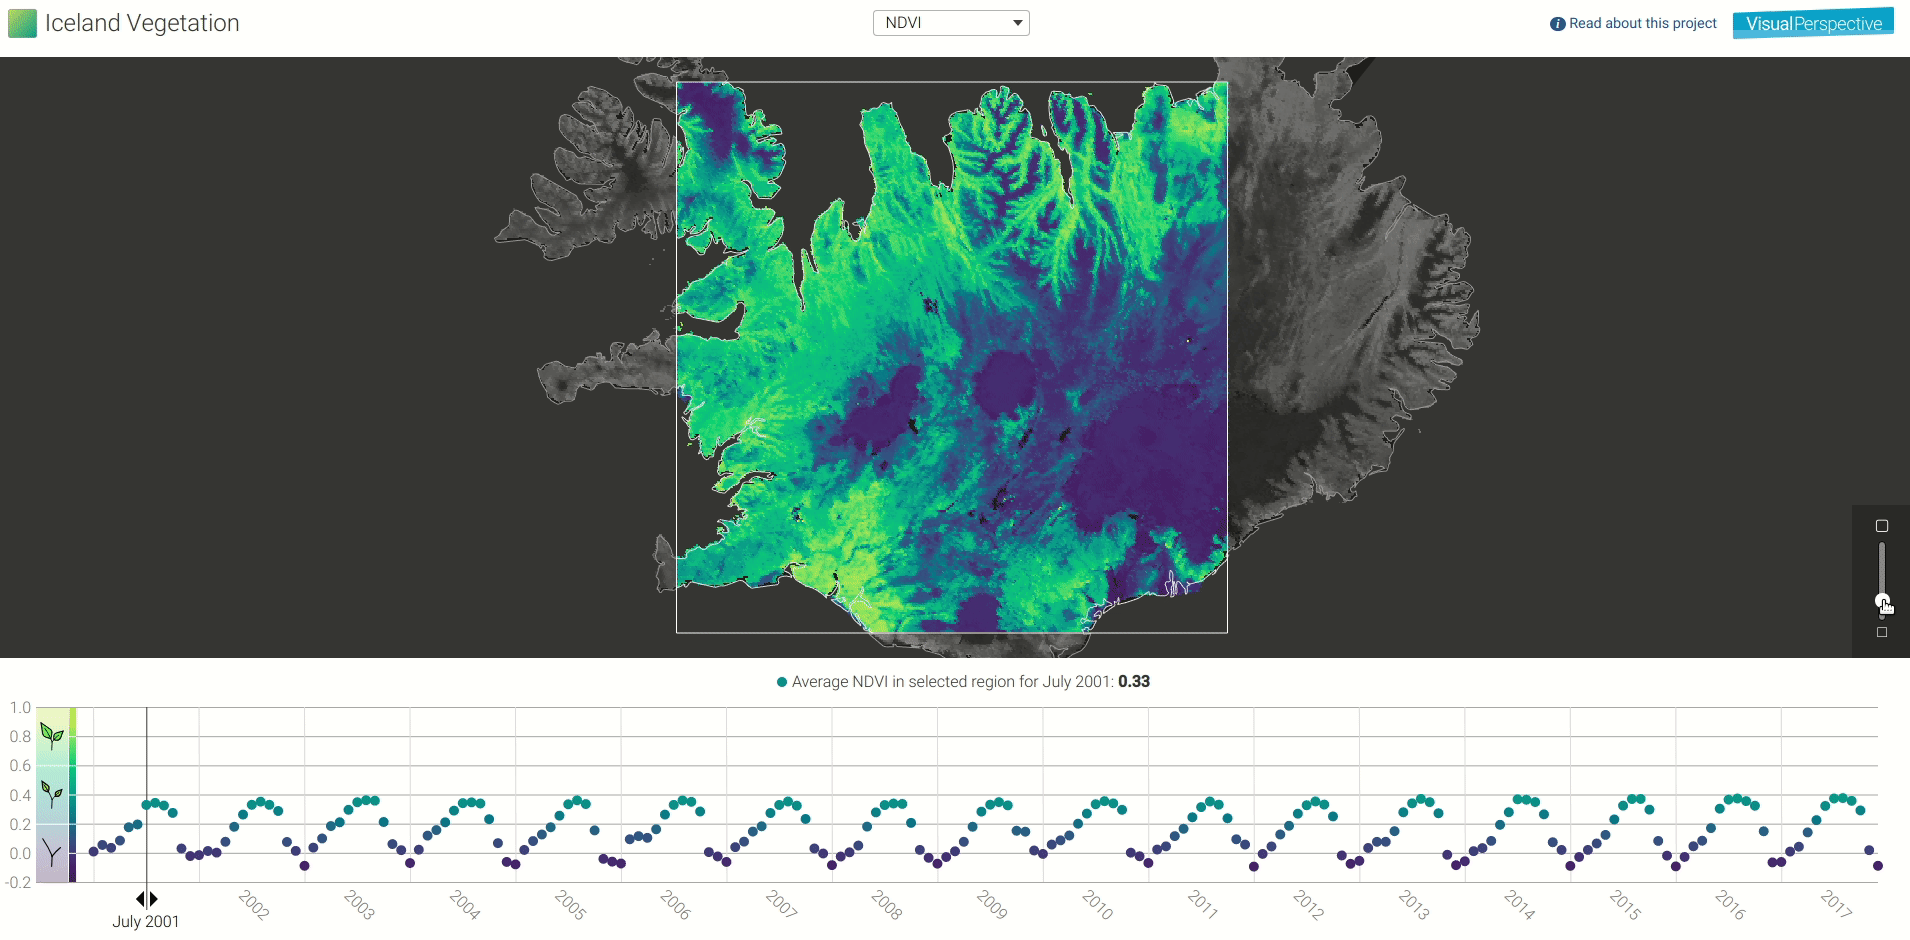
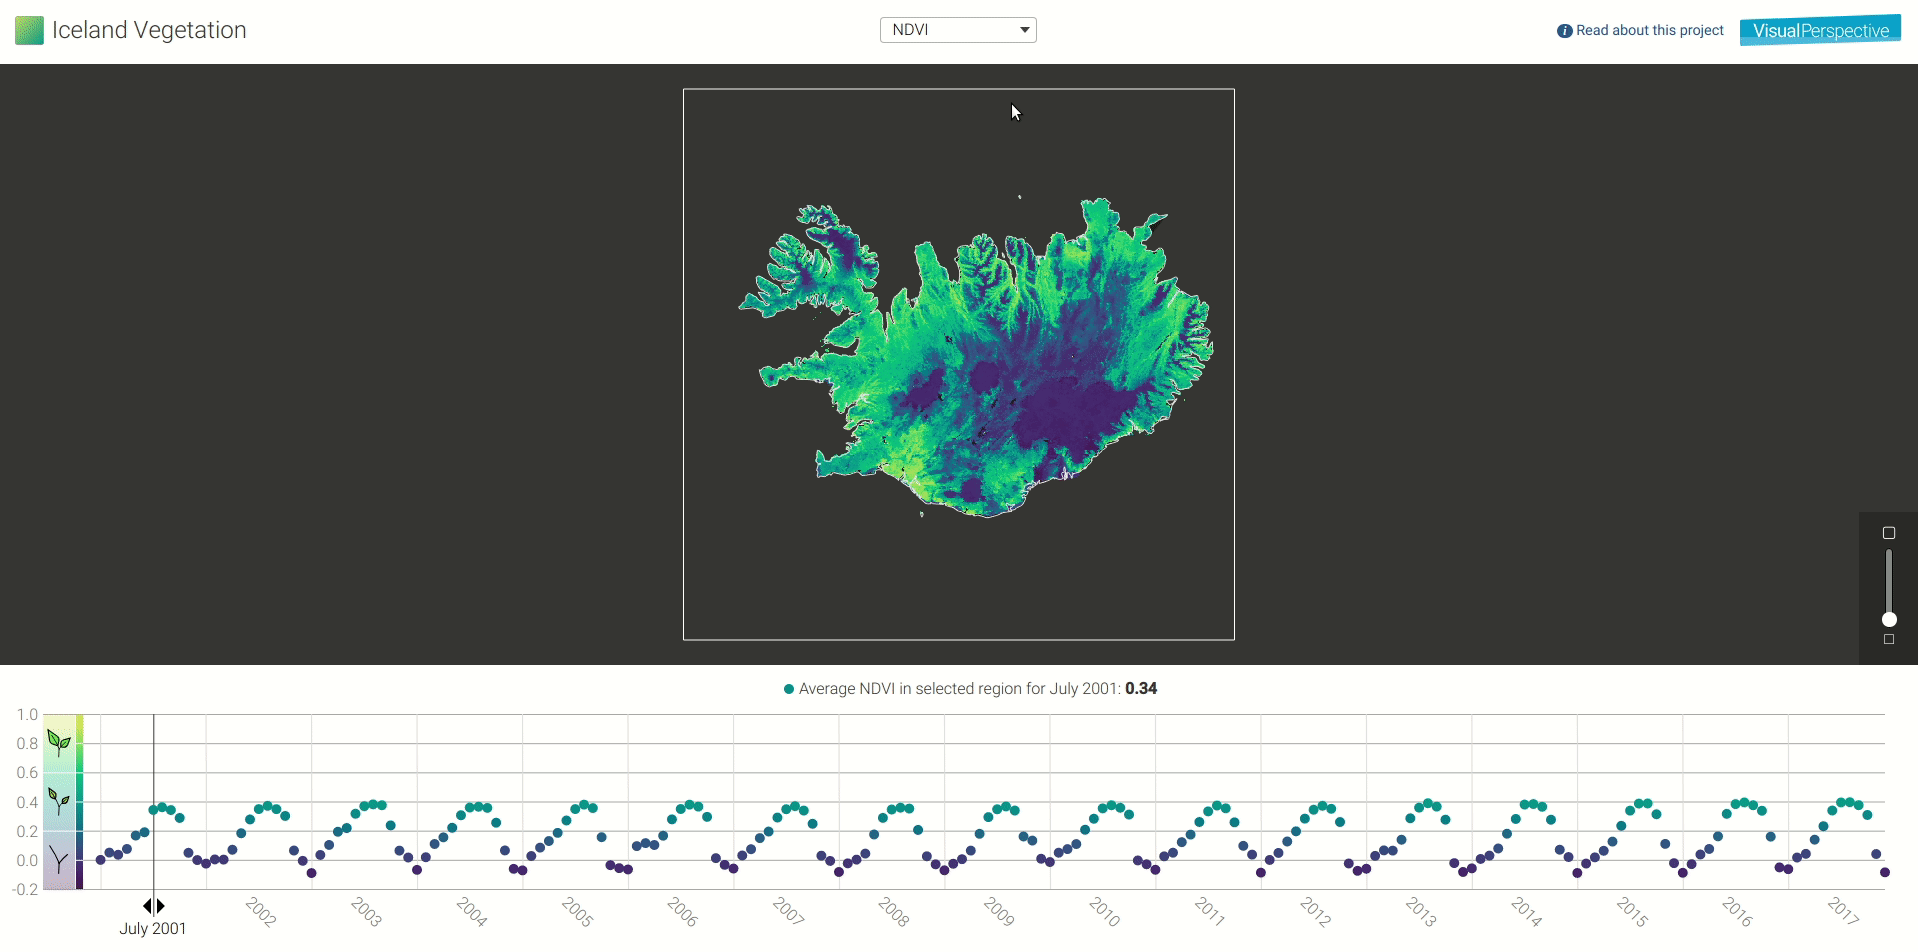
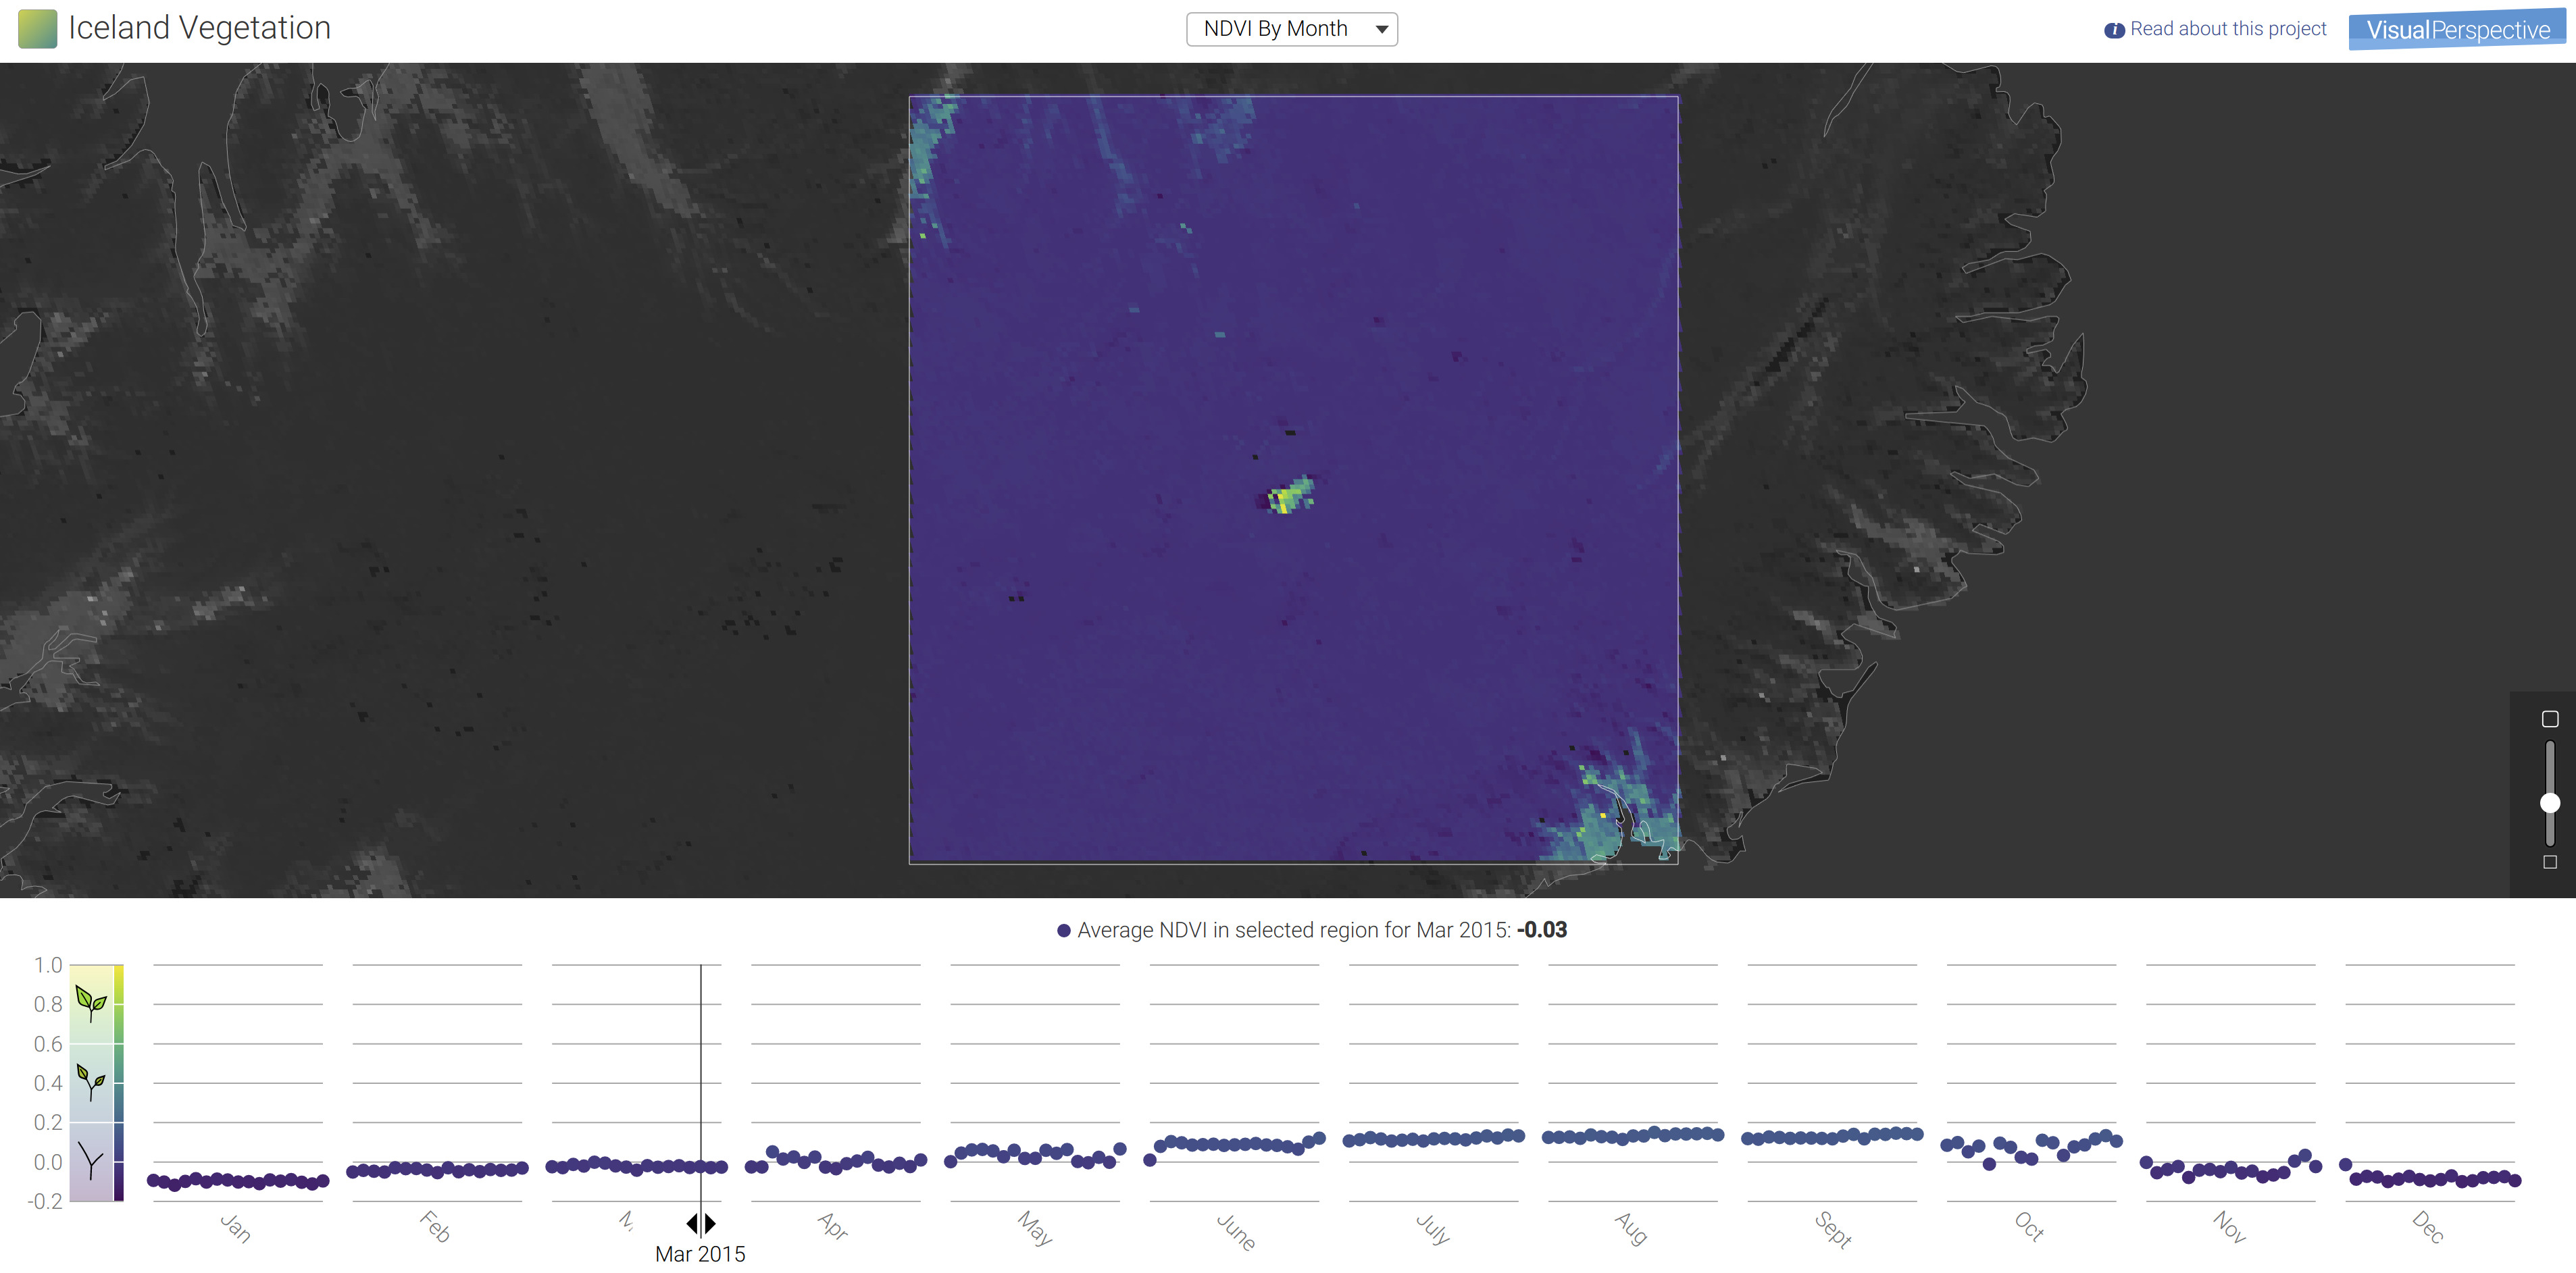
Previous experience using NDVI and other remote sensing products inspired us to create an interactive tool for exploring and visualizing datasets that had both temporal and spatial elements. We wanted to create an application that allowed the user to easily digest both the time and space aspects of the data. From this desire we created a web-based NDVI viewer with the current version showcasing Iceland’s vegetation (Figure 2):
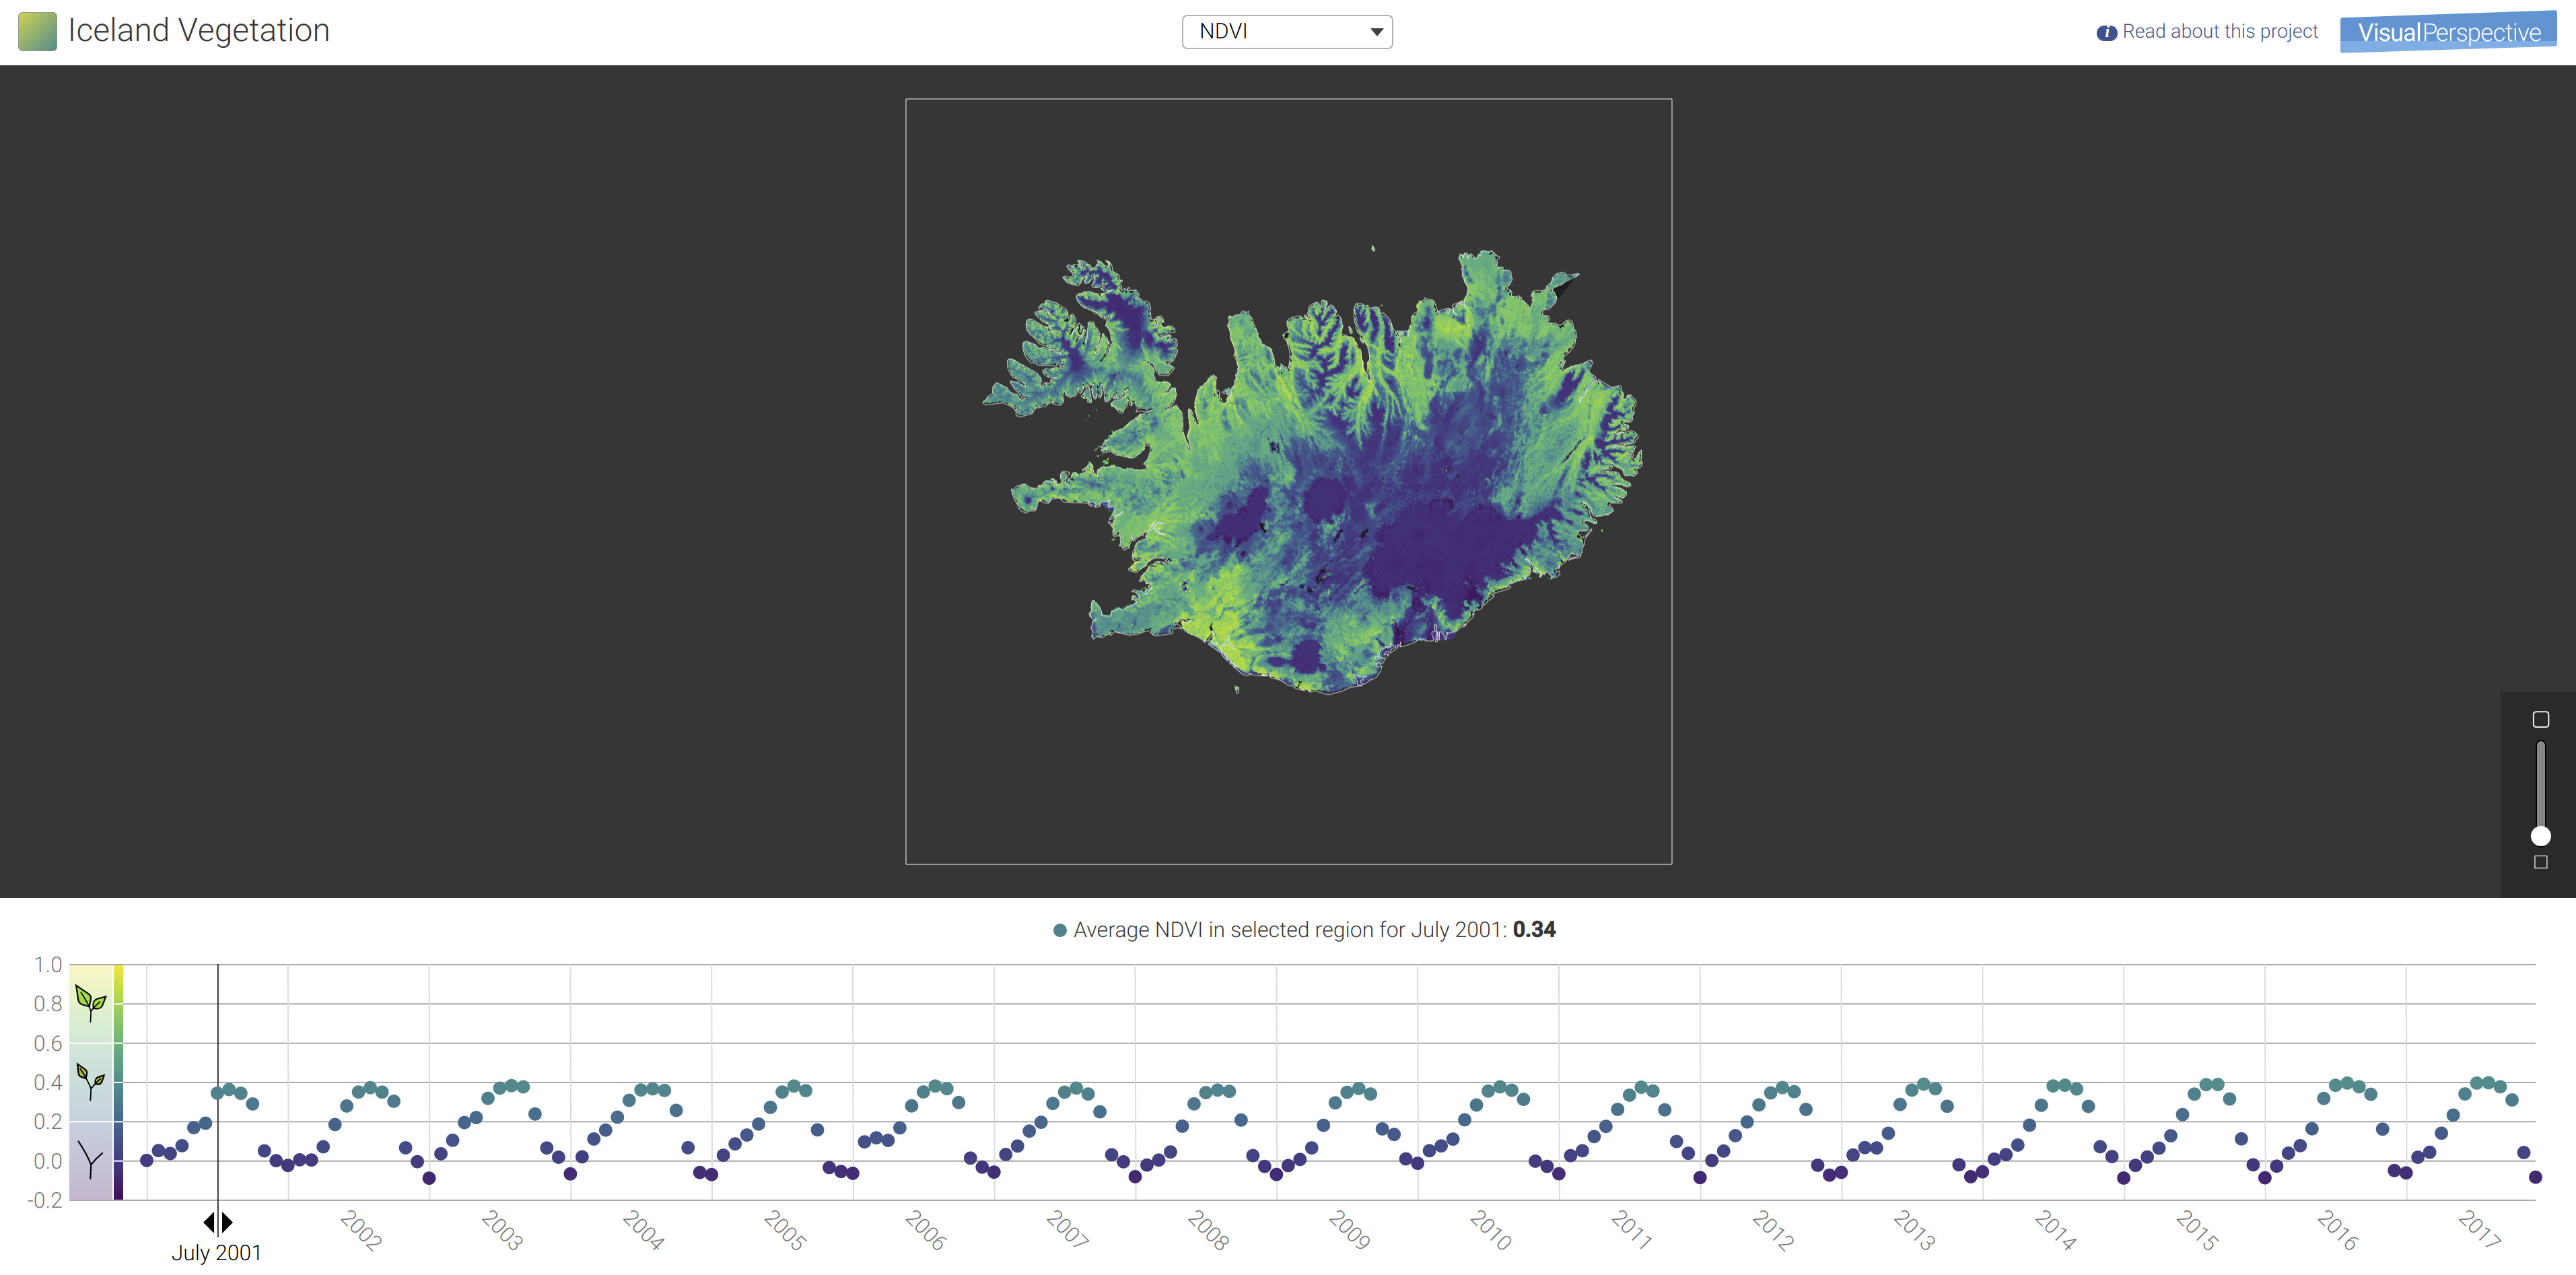
This application allows you to view monthly averaged NDVI of Iceland from NASA’s Moderate Resolution Imaging Spectroradiometer (MODIS) instrument aboard the Aqua and Terra spacecraft. The top image shows the spatial values of NDVI over Iceland for a particular month as indicated by the vertical line in the lower time-series graph. This line can be moved through time by left clicking on it and dragging it across the time series (GIF). As the line moves across the time series, the top spatial plot is updated with the corresponding month.
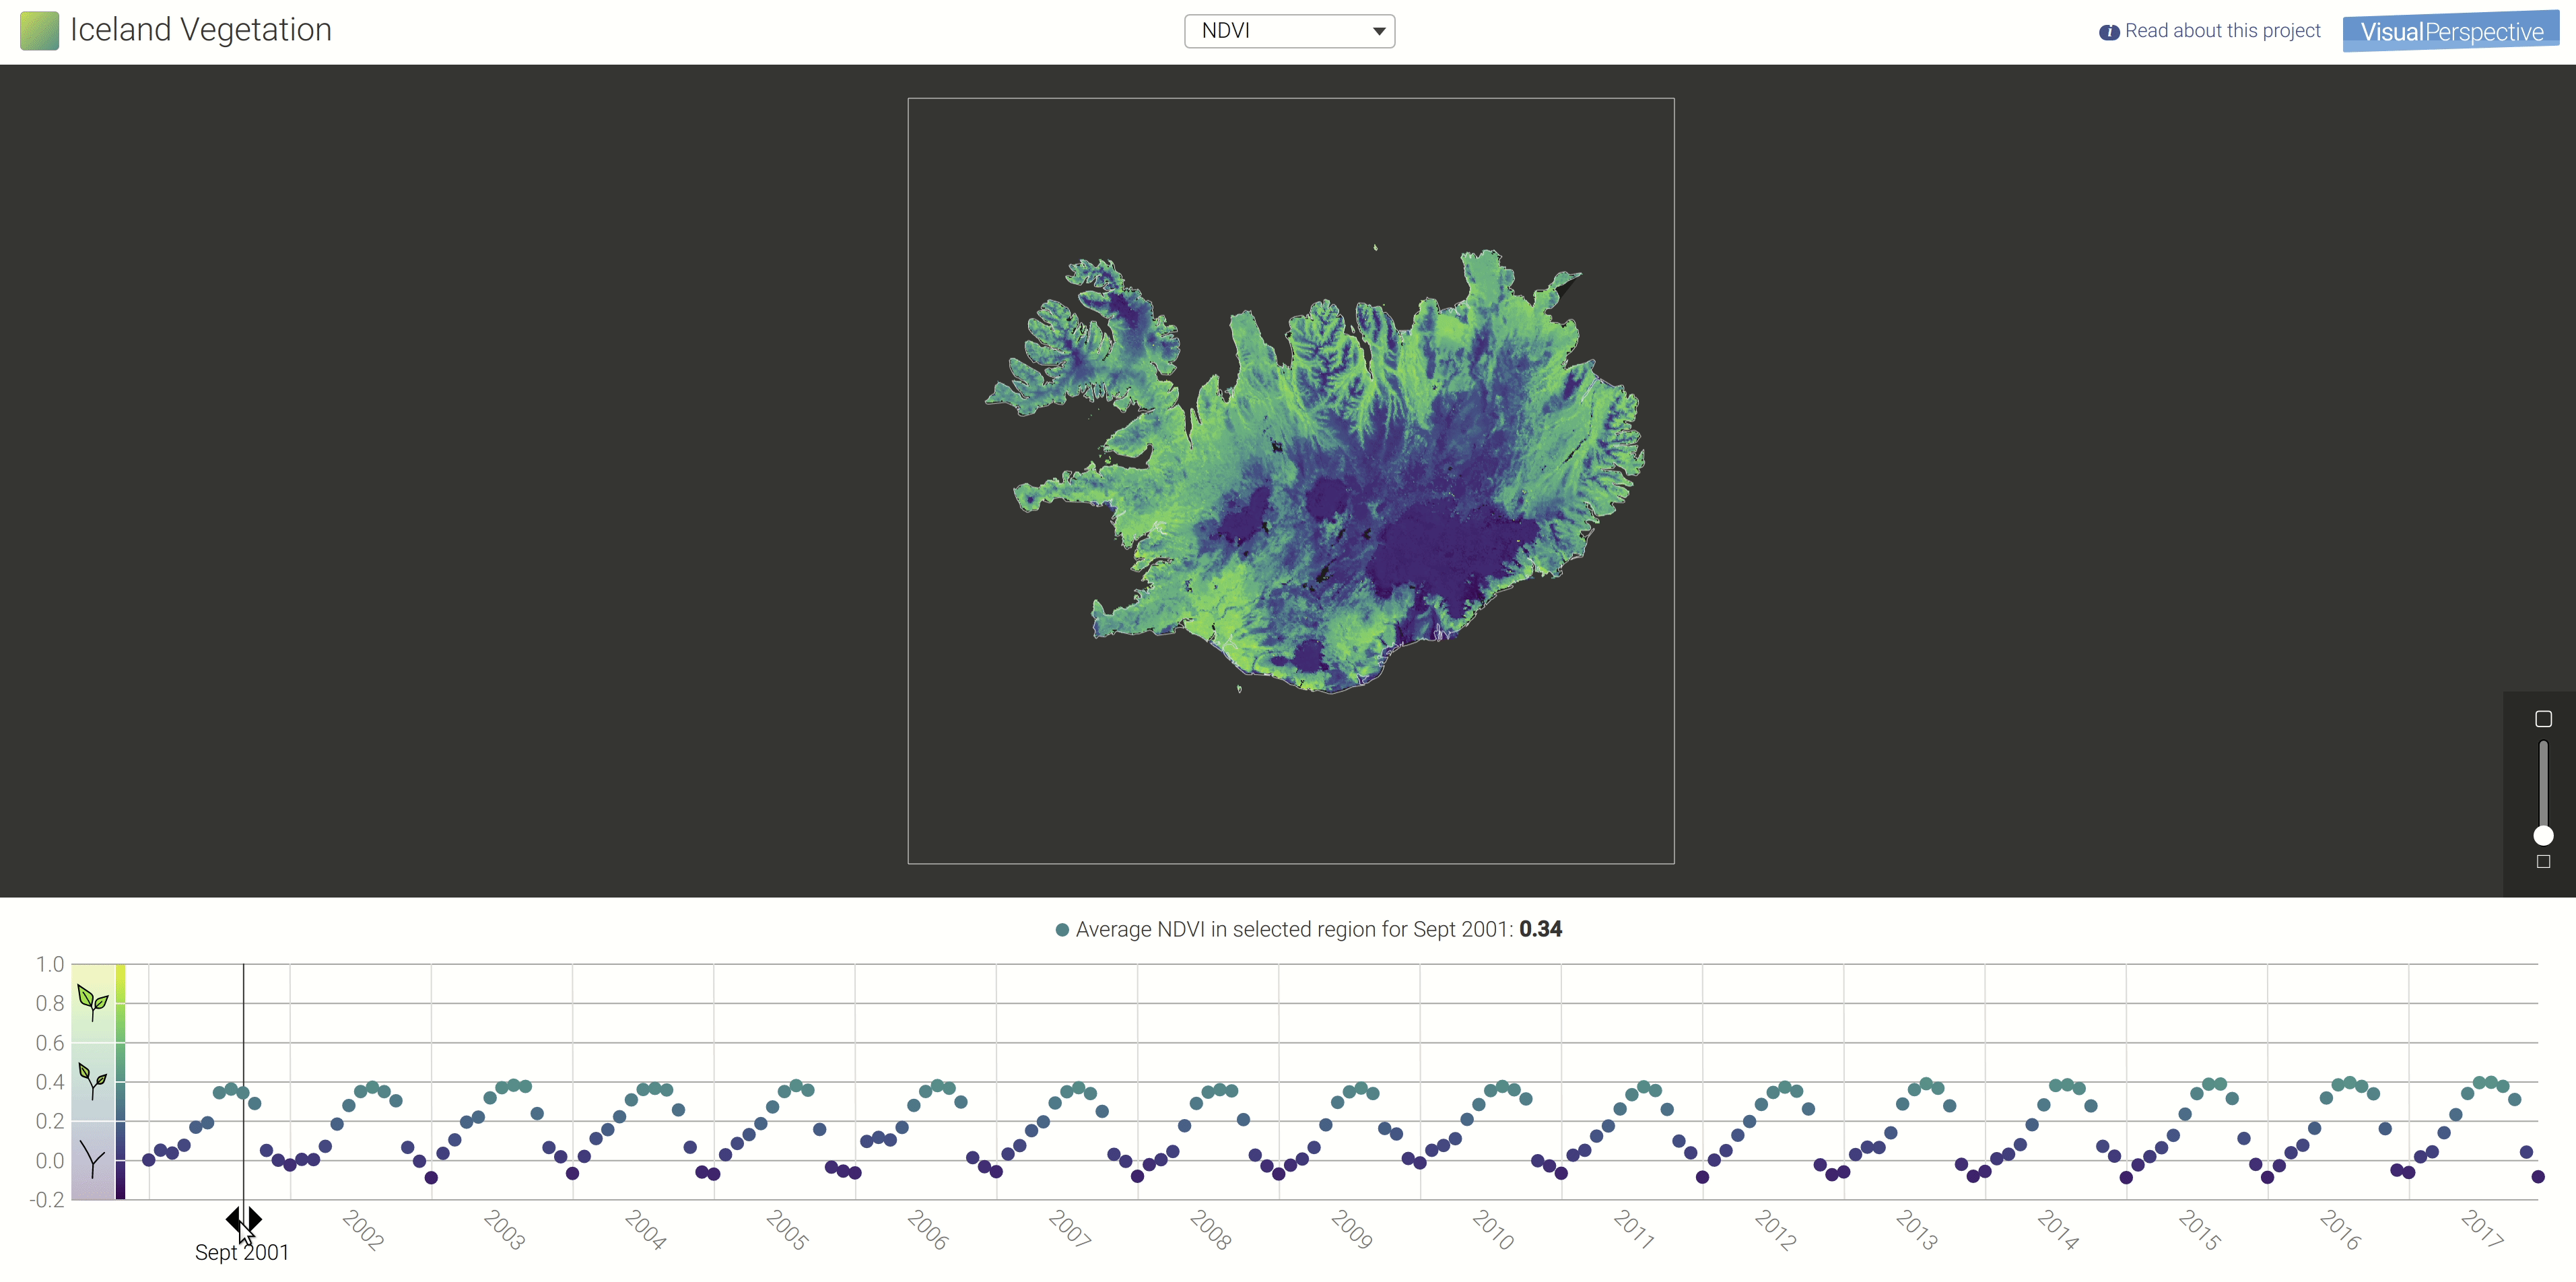
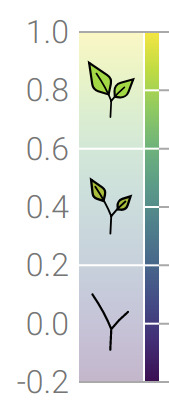
Both the spatial figure (top) and the time-series graph (bottom) have the same color scale for NDVI, which is displayed in the lower left-hand corner (Figure 3).
Although the current view includes all of Iceland, you can select a smaller spatial portion by using the zoom feature on the lower right-hand side of the image. You can also move the spatial image around to select different zoomed regions. Zooming and moving the spatial image around will automatically update the time series so the data points represent the currently selected view. In addition, mouse scrolling and left click will act to zoom and pan respectively.
In addition to the default time-series view, you can group the NDVI values by month by selecting ‘NDVI by month’ in the top drop down box. With this view you can get a sense of how NDVI changes over years for a particular month. For instance notice how, over the entirety of Iceland, NDVI for the months of July, August, and September remains relatively consistent over the period from 2001 to 2017, while the early spring and late fall months have much more variability.
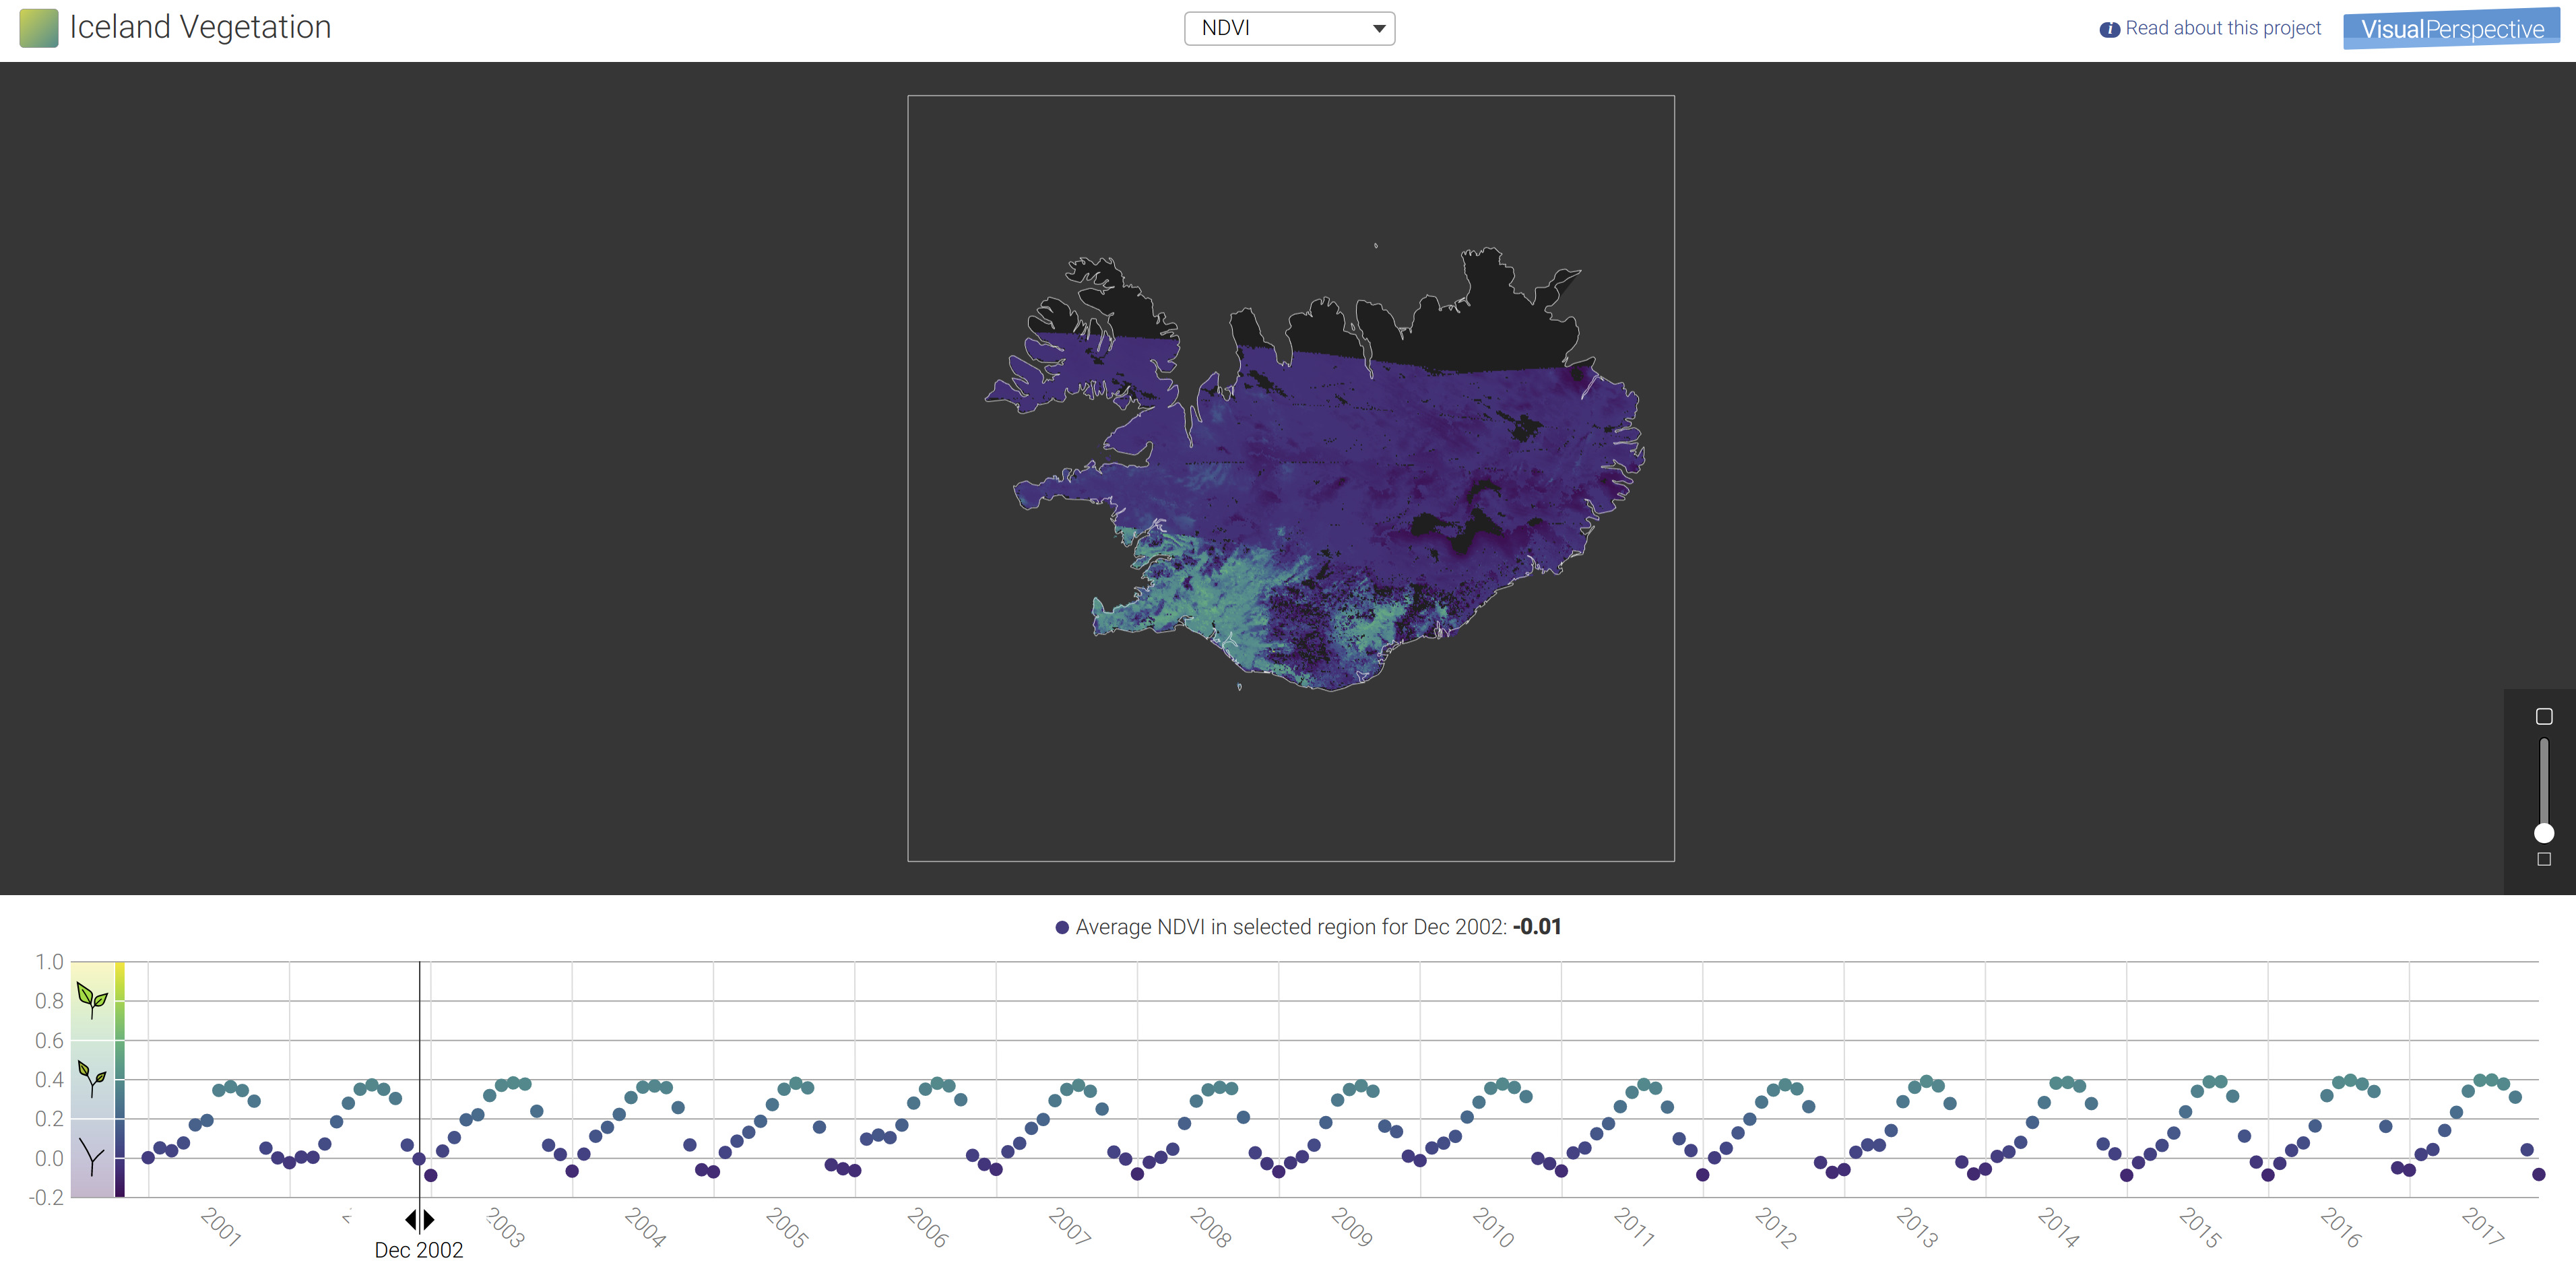
A Note about Missing Data
As with most data products, there exists the potential to have missing data. The remote sensing aspect of NDVI makes it susceptible to missing data. Missing NDVI data can represent the inability to collect data for that particular pixel. This can be caused by the presence of clouds which obscure observation of the ground. In addition, in high latitude regions, such as the northern regions of Iceland, missing data can also be due to the lack of direct sunlight. During December (Northern Hemisphere winter), the northern portion of Iceland does not receive enough visible light from the sun for the MODIS instrument to make observations. This is evident in missing data in the section seen in Figure 4. In our NDVI viewer we represent missing data as black pixels.
Iceland Through the Lens of NDVI
With Visual Perspective’s Iceland NDVI Viewer we were able to observe two interesting phenomena.
Construction of the Kárahnjúkar Hydropower Plant
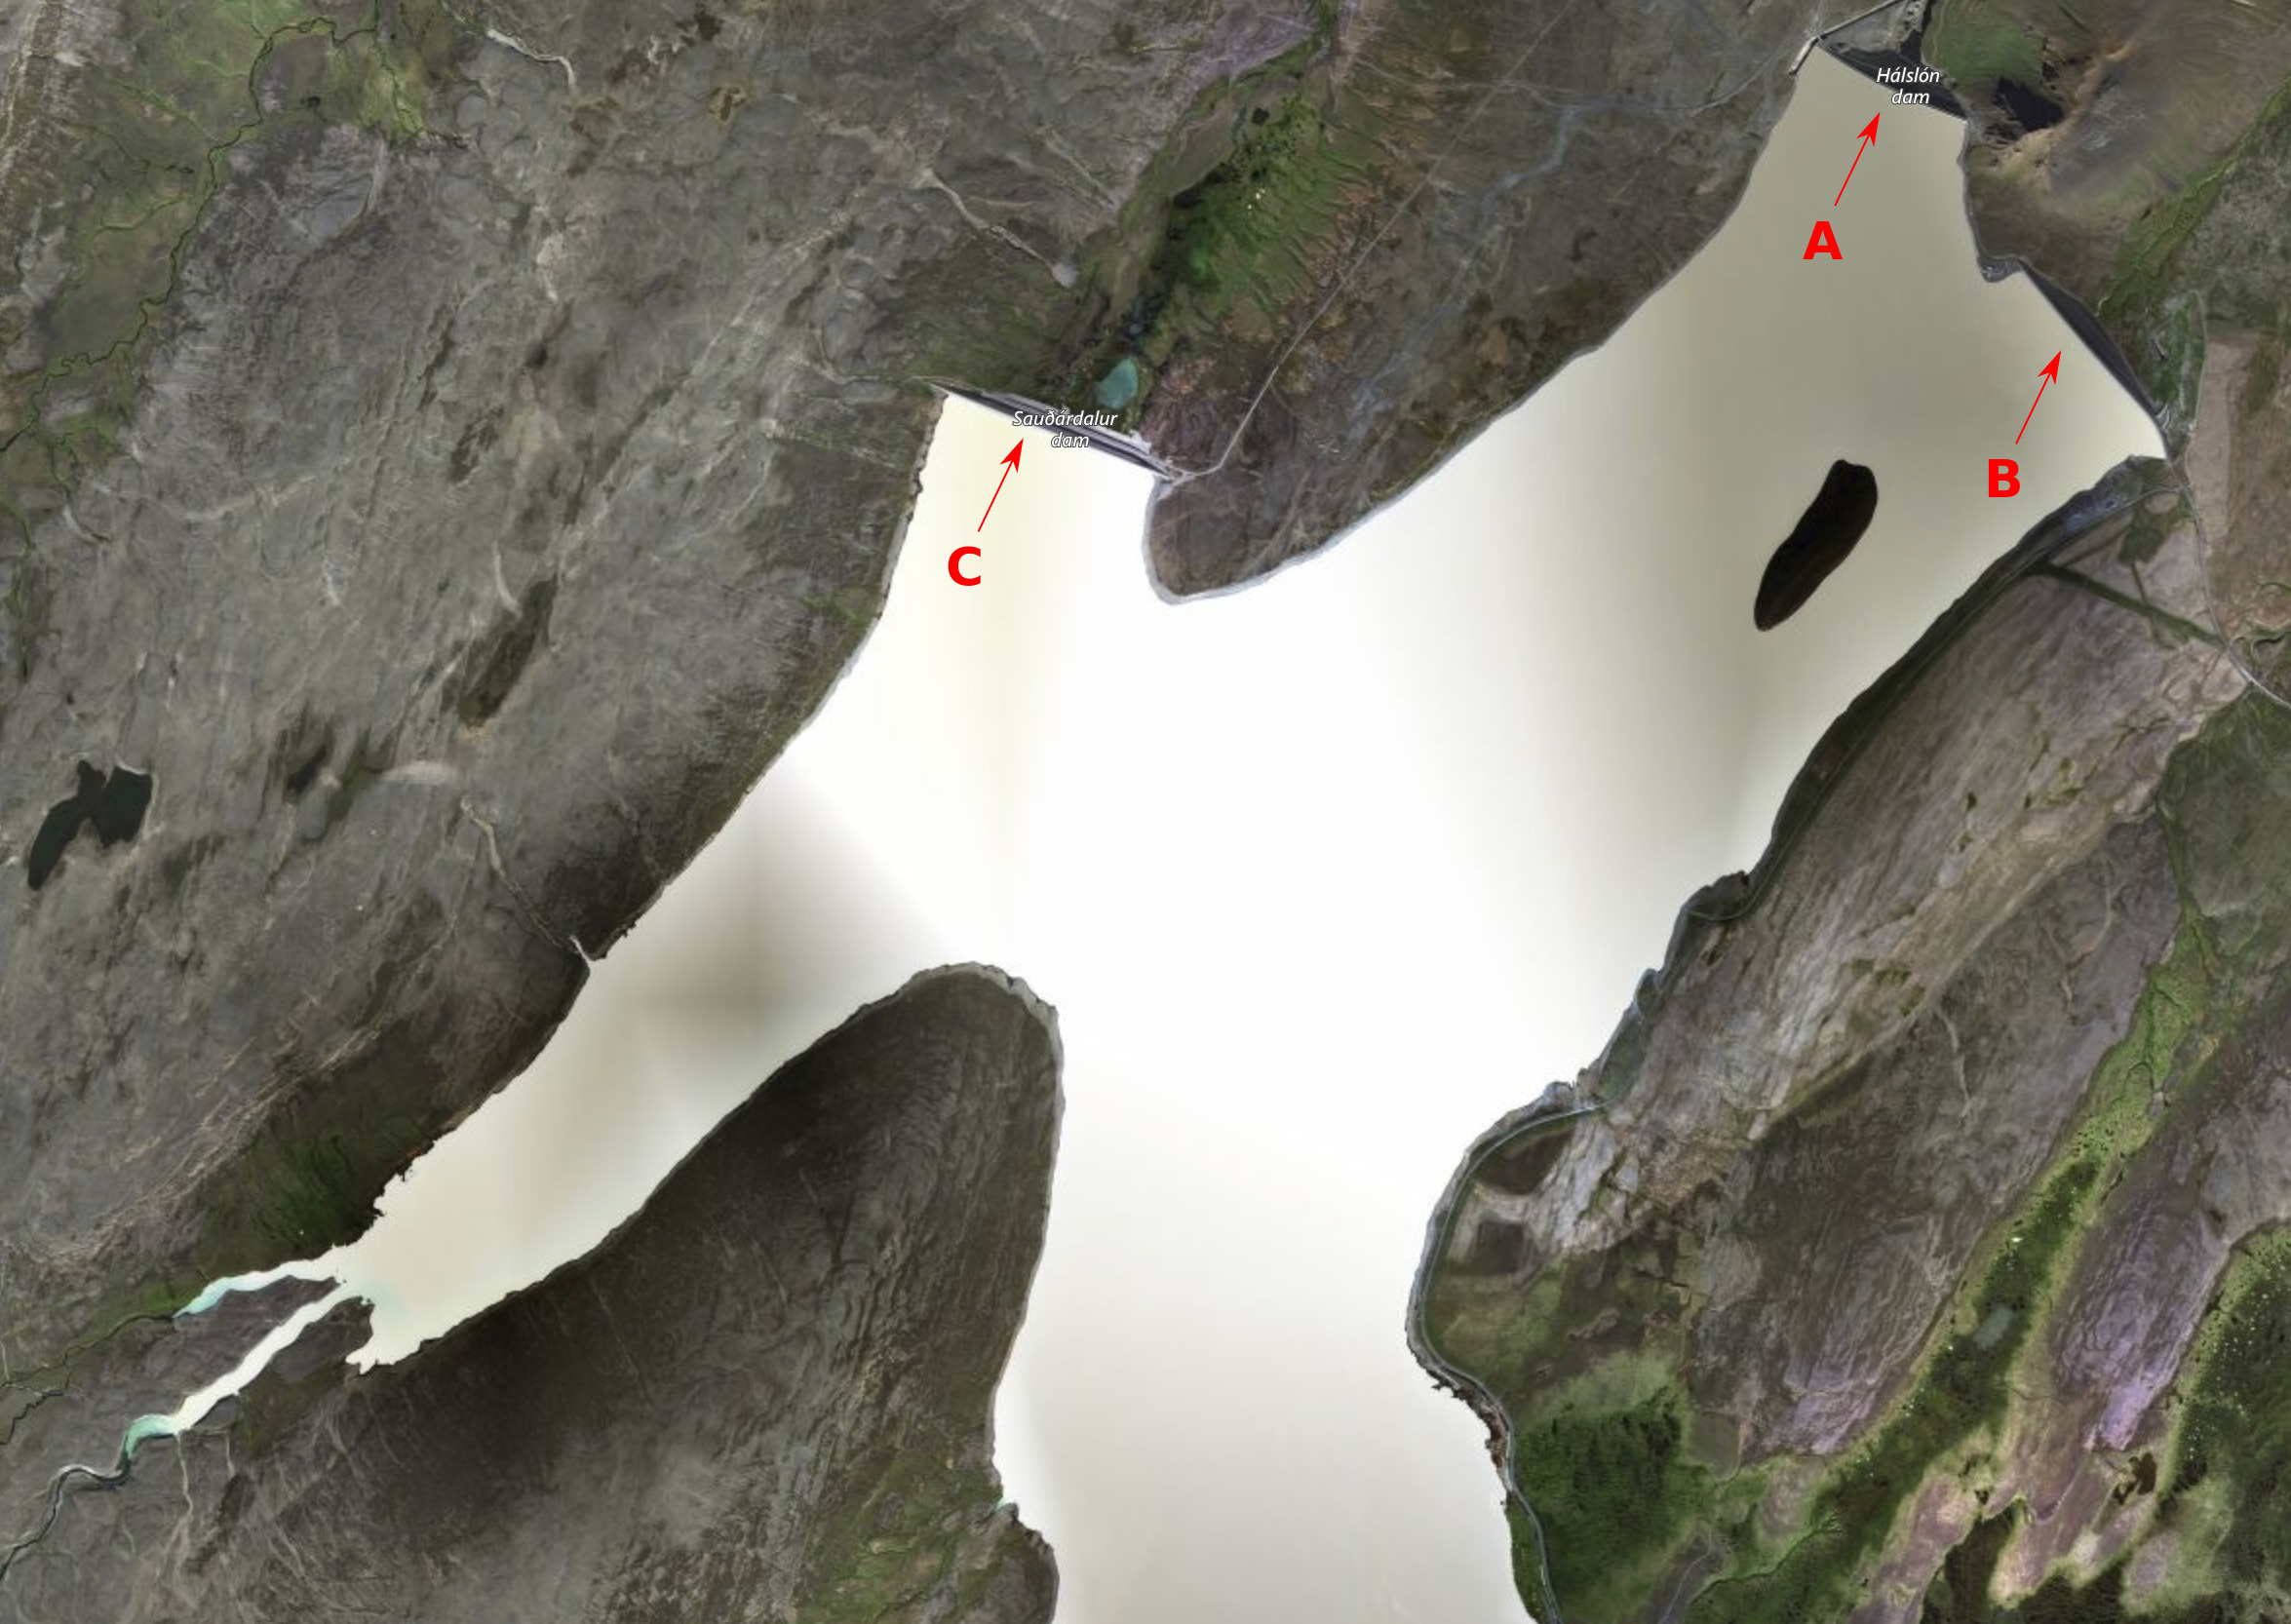
The Kárahnjúkar Hydropower Plant, also known as the Fljótsdalur Power Station, is a hydroelectric power plant in eastern Iceland. It was designed to produce energy for Alcoa's Fjarðaál aluminum smelter 75 kilometres (47 mi) to the east in Reyðarfjörður. As part of the hydropower plant, three major dams were constructed on the Jökulsá á Dal river; the Kárahnjúkar Dam, the Desjará Dam, and the Sauðárdalur Dam. These dams created one of Europe's largest reservoirs, the Hálslón Reservoir. The Hálslón Reservoir is visible in Figure 5, while the three major dams can be seen in Figure 6.
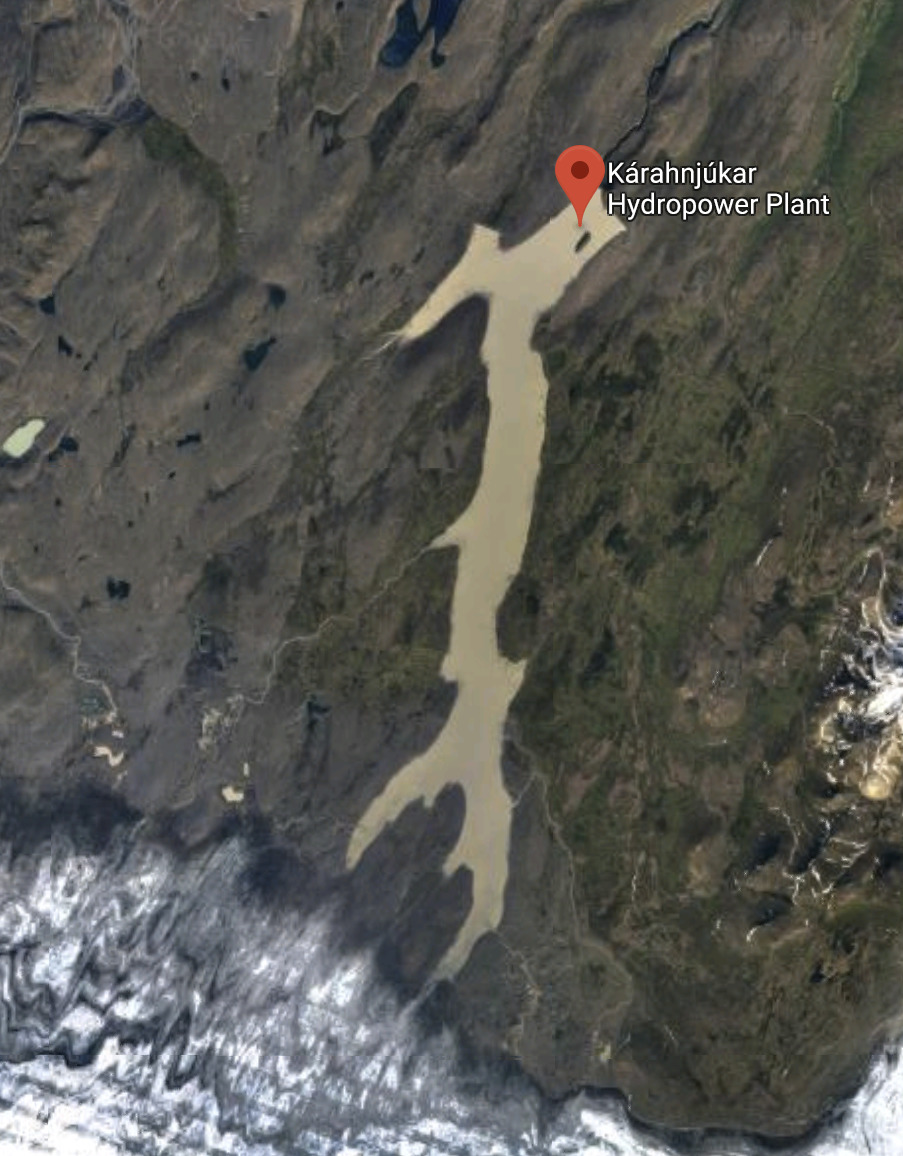
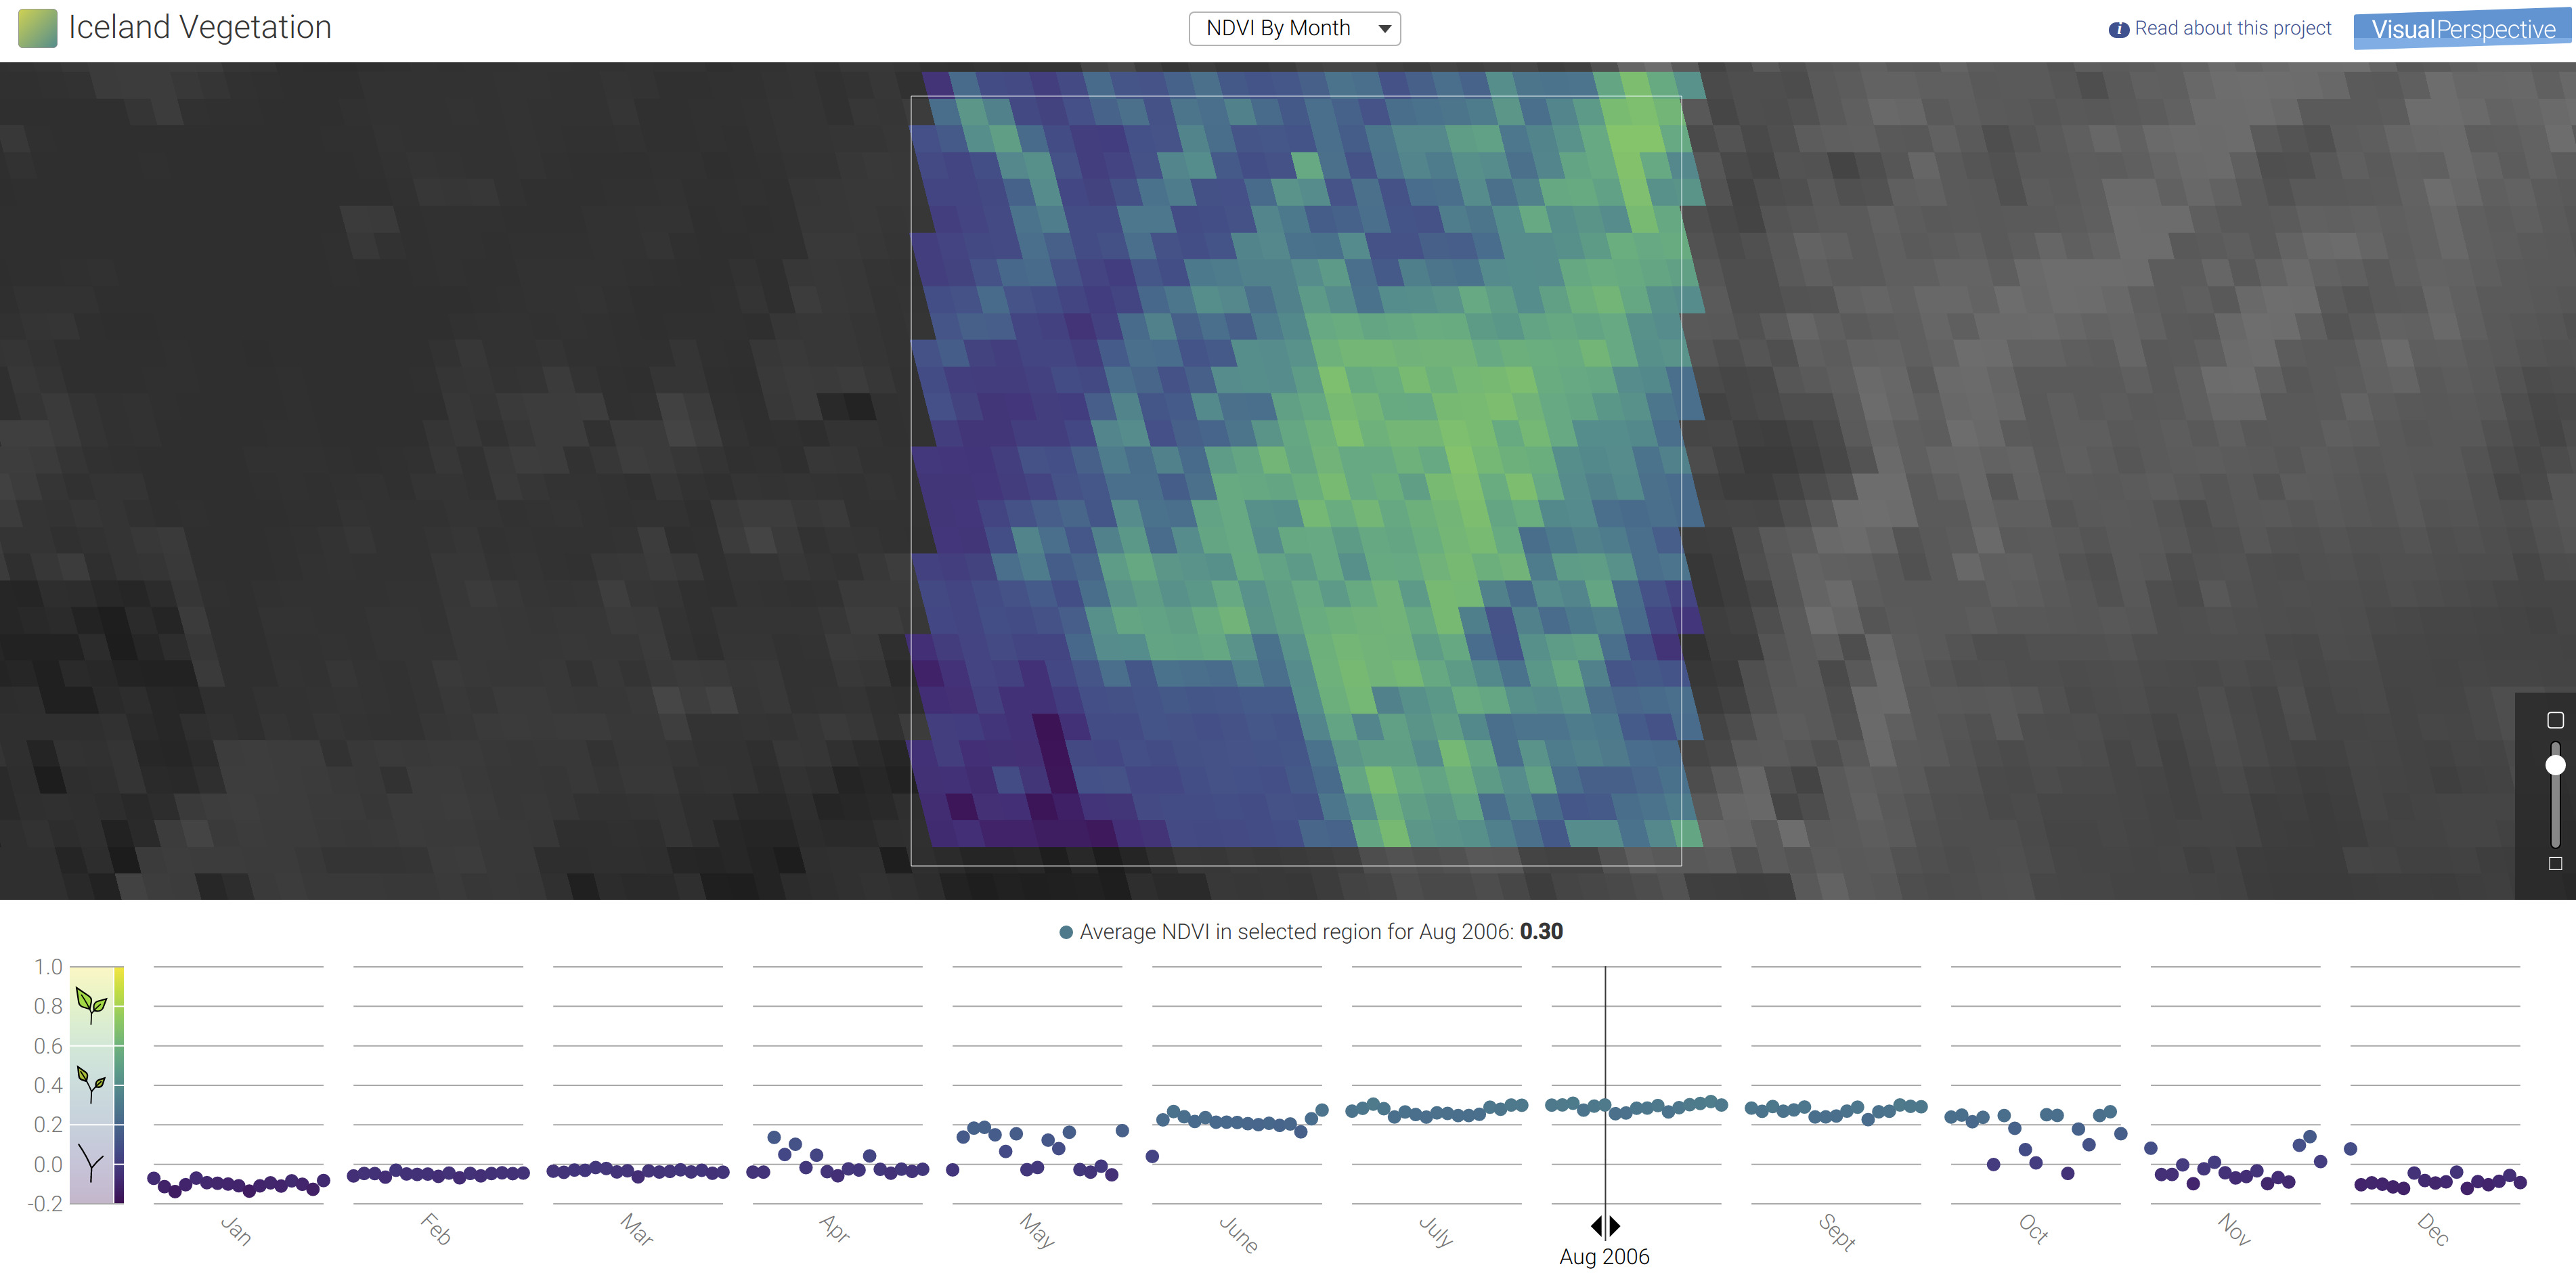
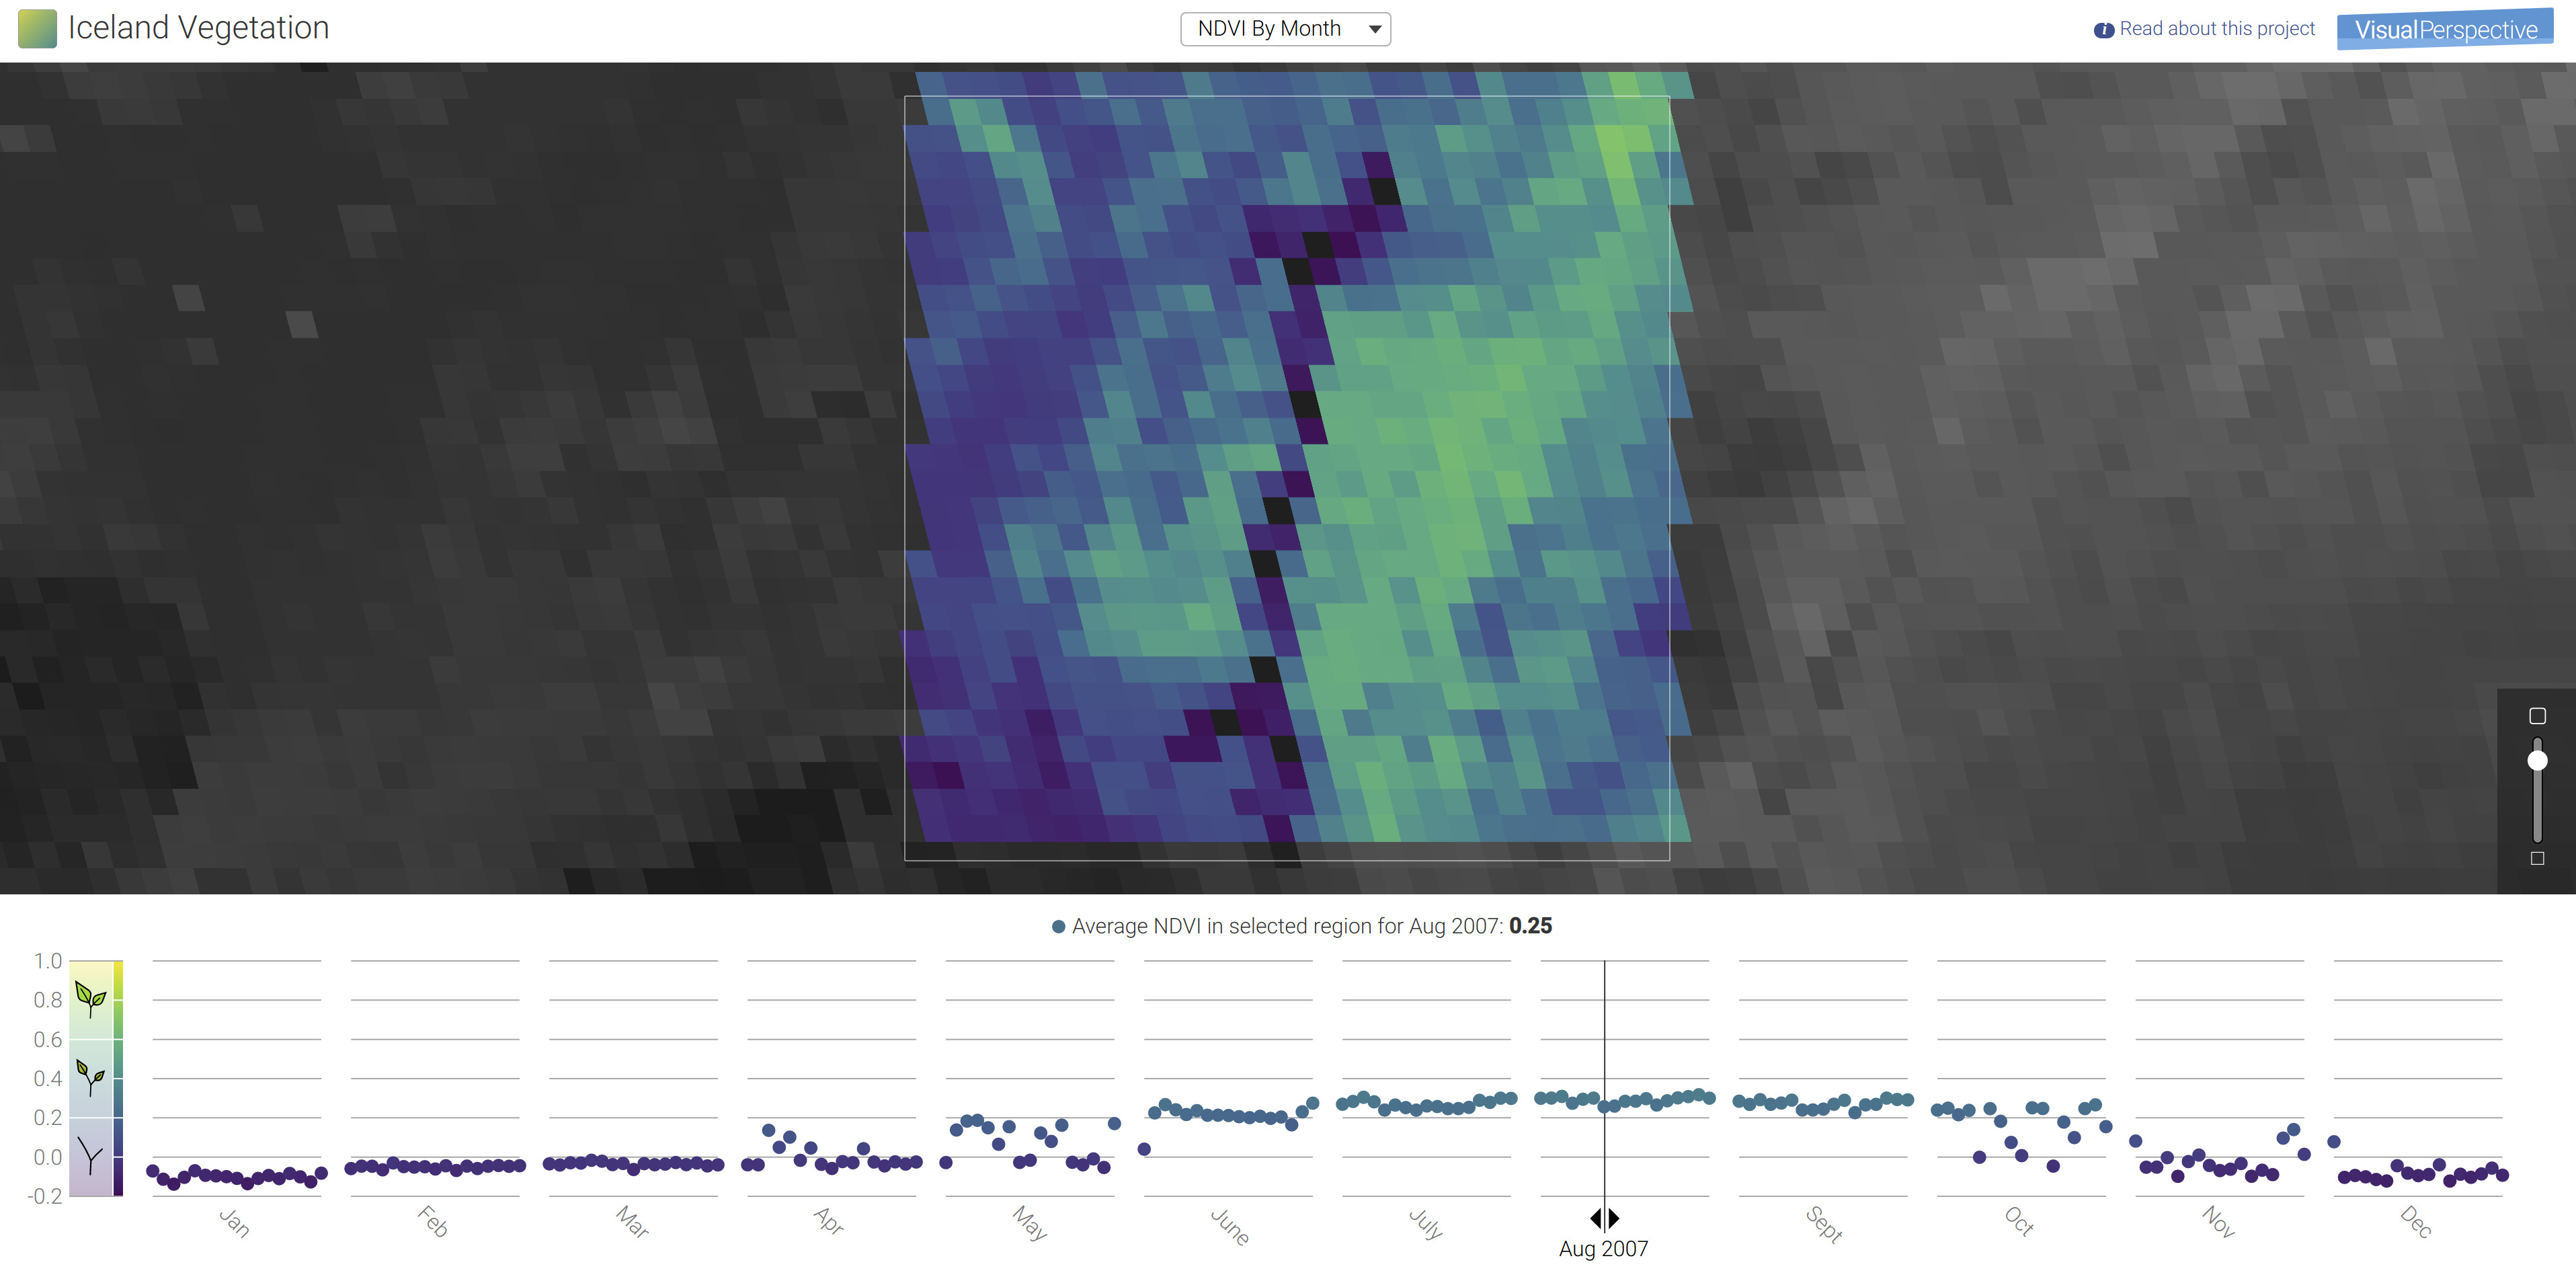
The Hálslón Reservoir began to fill in September 2006, and it leaves a very distinct signature in NDVI time series. The impact of the man-made reservoir changed the NDVI signature and is visible in the difference between Figure 7 and Figure 8. Figure 7 shows the monthly averaged NDVI for August 2006 (before the filling of the reservoir), while Figure 8 shows the monthly averaged NDVI for August 2007 (after the filling of the reservoir). The reduction in NDVI for that region reveals the reduction in vegetation from the filling of the reservoir.
Well... We are not Really Sure What Happened
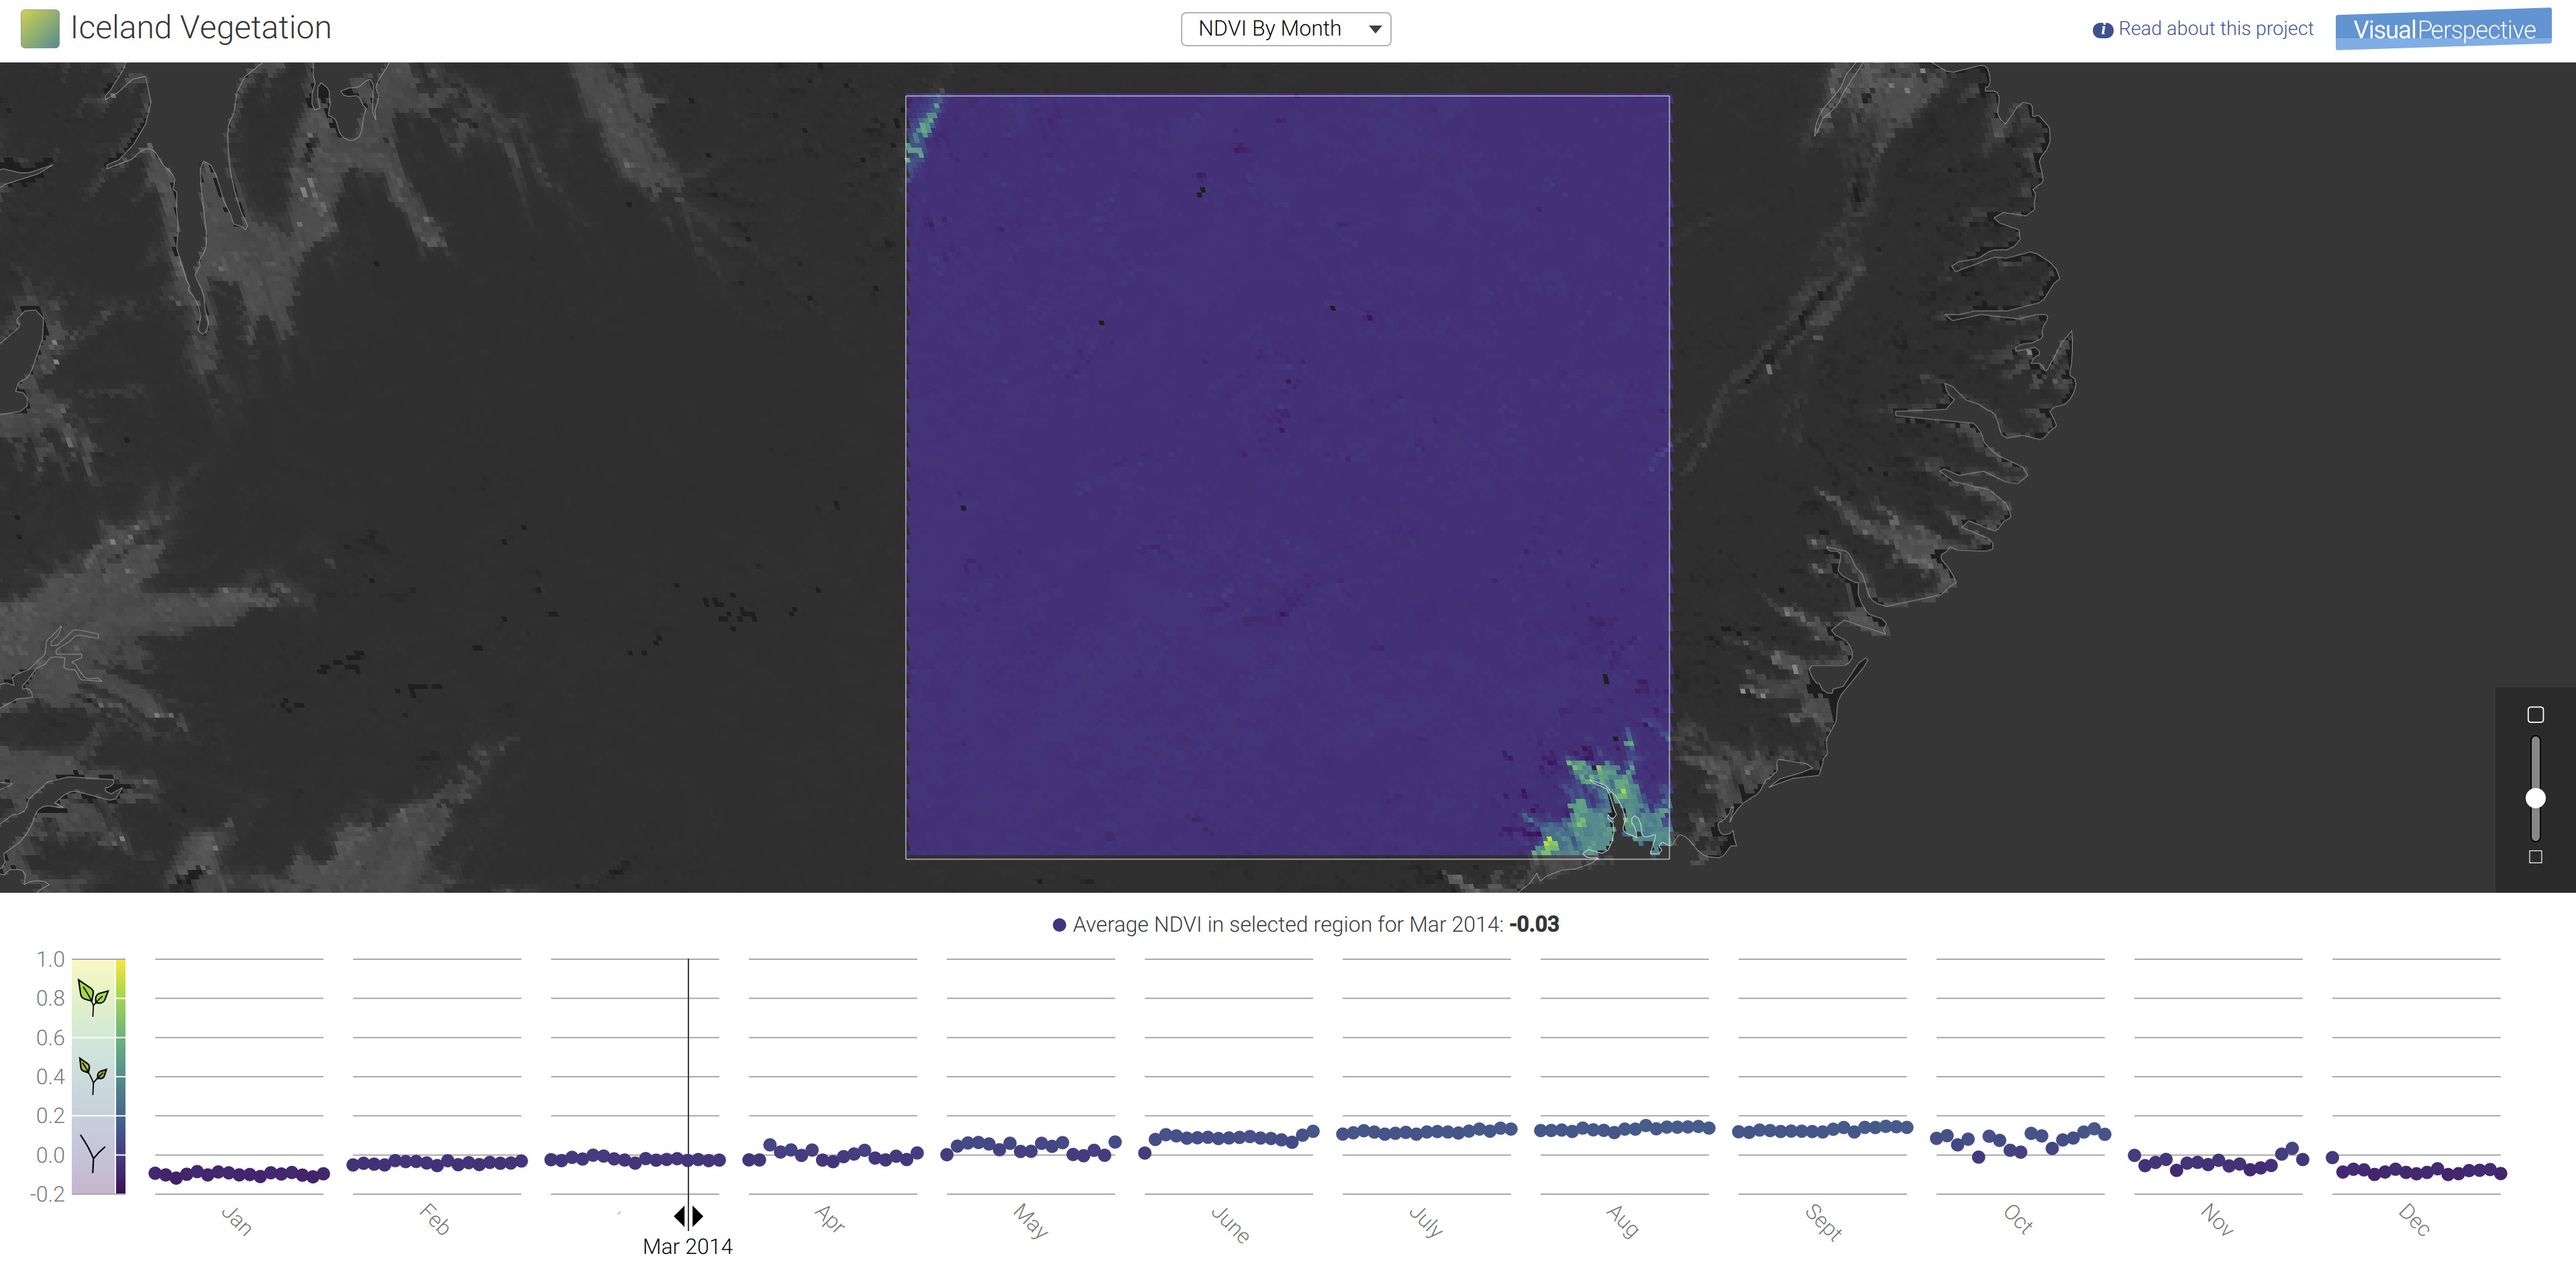
For the second phenomenon, we are not really sure what occured. We found a significant increase in NDVI starting in 2015 between the months of March and May. The region is just north of the largest ice cap in Iceland, Vatnajökull and south of the lake Askja. Figure 9 shows the region in May of 2014, while Figure 10 shows the same region in May of 2015. The increase in NDVI is present up through 2017 and is absent prior to 2015. We speculate that this could be in some way related to runoff from the Vatnajökull ice cap. Let us know if you are familiar with that area or have any ideas. You can contact us through the Visual Perspective contact Page.
This phenomenon is also clearly evident when looking at the calculated NDVI anomaly map, which will be coming soon.
Future Work
Another way to view these phenomena is through calculating the NDVI anomaly. The anomaly is the difference between the monthly NDVI value and a climatological mean. Visualizing the anomaly highlights regions which are above or below the climatological mean for that month. Stay tuned, we are adding NDVI anomaly along with a detailed explanation to the viewer as our next project.
How Can Visual Perspective Help You?
We hope you enjoy this blog post and the NDVI visualization. Our passion is to create meaningful visualization and understanding of data. Let us know how we can help you, contact us.
References
Barnes, E.M., Clarke, T.R., Richards, S.E., Colaizzi, P.D., Haberland, J., Kostrzewski, M., Waller, P., Choi, C., Riley, E., Thompson, T. and Lascano, R.J., 2000, July. Coincident detection of crop water stress, nitrogen status and canopy density using ground based multispectral data. In Proceedings of the Fifth International Conference on Precision Agriculture, Bloomington, MN, USA (Vol. 1619).
Gu, Y., Hunt, E., Wardlow, B., Basara, J.B., Brown, J.F. and Verdin, J.P., 2008. Evaluation of MODIS NDVI and NDWI for vegetation drought monitoring using Oklahoma Mesonet soil moisture data. Geophysical Research Letters, 35(22).
Imhoff, M.L., Tucker, C.J., Lawrence, W.T. and Stutzer, D.C., 2000. The use of multisource satellite and geospatial data to study the effect of urbanization on primary productivity in the United States. IEEE Transactions on Geoscience and Remote Sensing, 38(6), pp.2549-2556.
Panda, Sudhanshu & Ames, Daniel & Suranjan, Panigrahi. (2010). Application of Vegetation Indices for Agricultural Crop Yield Prediction Using Neural Network Techniques. Remote Sensing. 2. 10.3390/rs2030673.
Quarmby, N.A., Milnes, M., Hindle, T.L. and Silleos, N., 1993. The use of multi-temporal NDVI measurements from AVHRR data for crop yield estimation and prediction. International Journal of Remote Sensing, 14(2), pp.199-210.
Raynolds, M., Magnússon, B., Metúsalemsson, S. and Magnússon, S.H., 2015. Warming, sheep and volcanoes: Land cover changes in Iceland evident in satellite NDVI trends. Remote Sensing, 7(8), pp.9492-9506.
Rulinda, C.M., Dilo, A., Bijker, W. and Stein, A., 2012. Characterising and quantifying vegetative drought in East Africa using fuzzy modelling and NDVI data. Journal of Arid Environments, 78, pp.169-178.
Szép, T., Møller, A.P., Piper, S., Nuttall, R., Szabó, Z.D. and Pap, P.L., 2006. Searching for potential wintering and migration areas of a Danish Barn Swallow population in South Africa by correlating NDVI with survival estimates. Journal of Ornithology, 147(2), pp.245-253.