


Iceland's Vegetation as Viewed Through Anomalies
How many of us have had the story “Miss Rumphius” read to us or have read this story to our children? The fictional character in this story, Miss Rumphius, inspired by the real life "Lupine Lady," Hilda Hamlin, plants Lupines in her community. Although the story does not specify the location of Miss Rumphius’s home, we believe she may have visited Iceland at some point. Keep reading to find out why...
Introduction
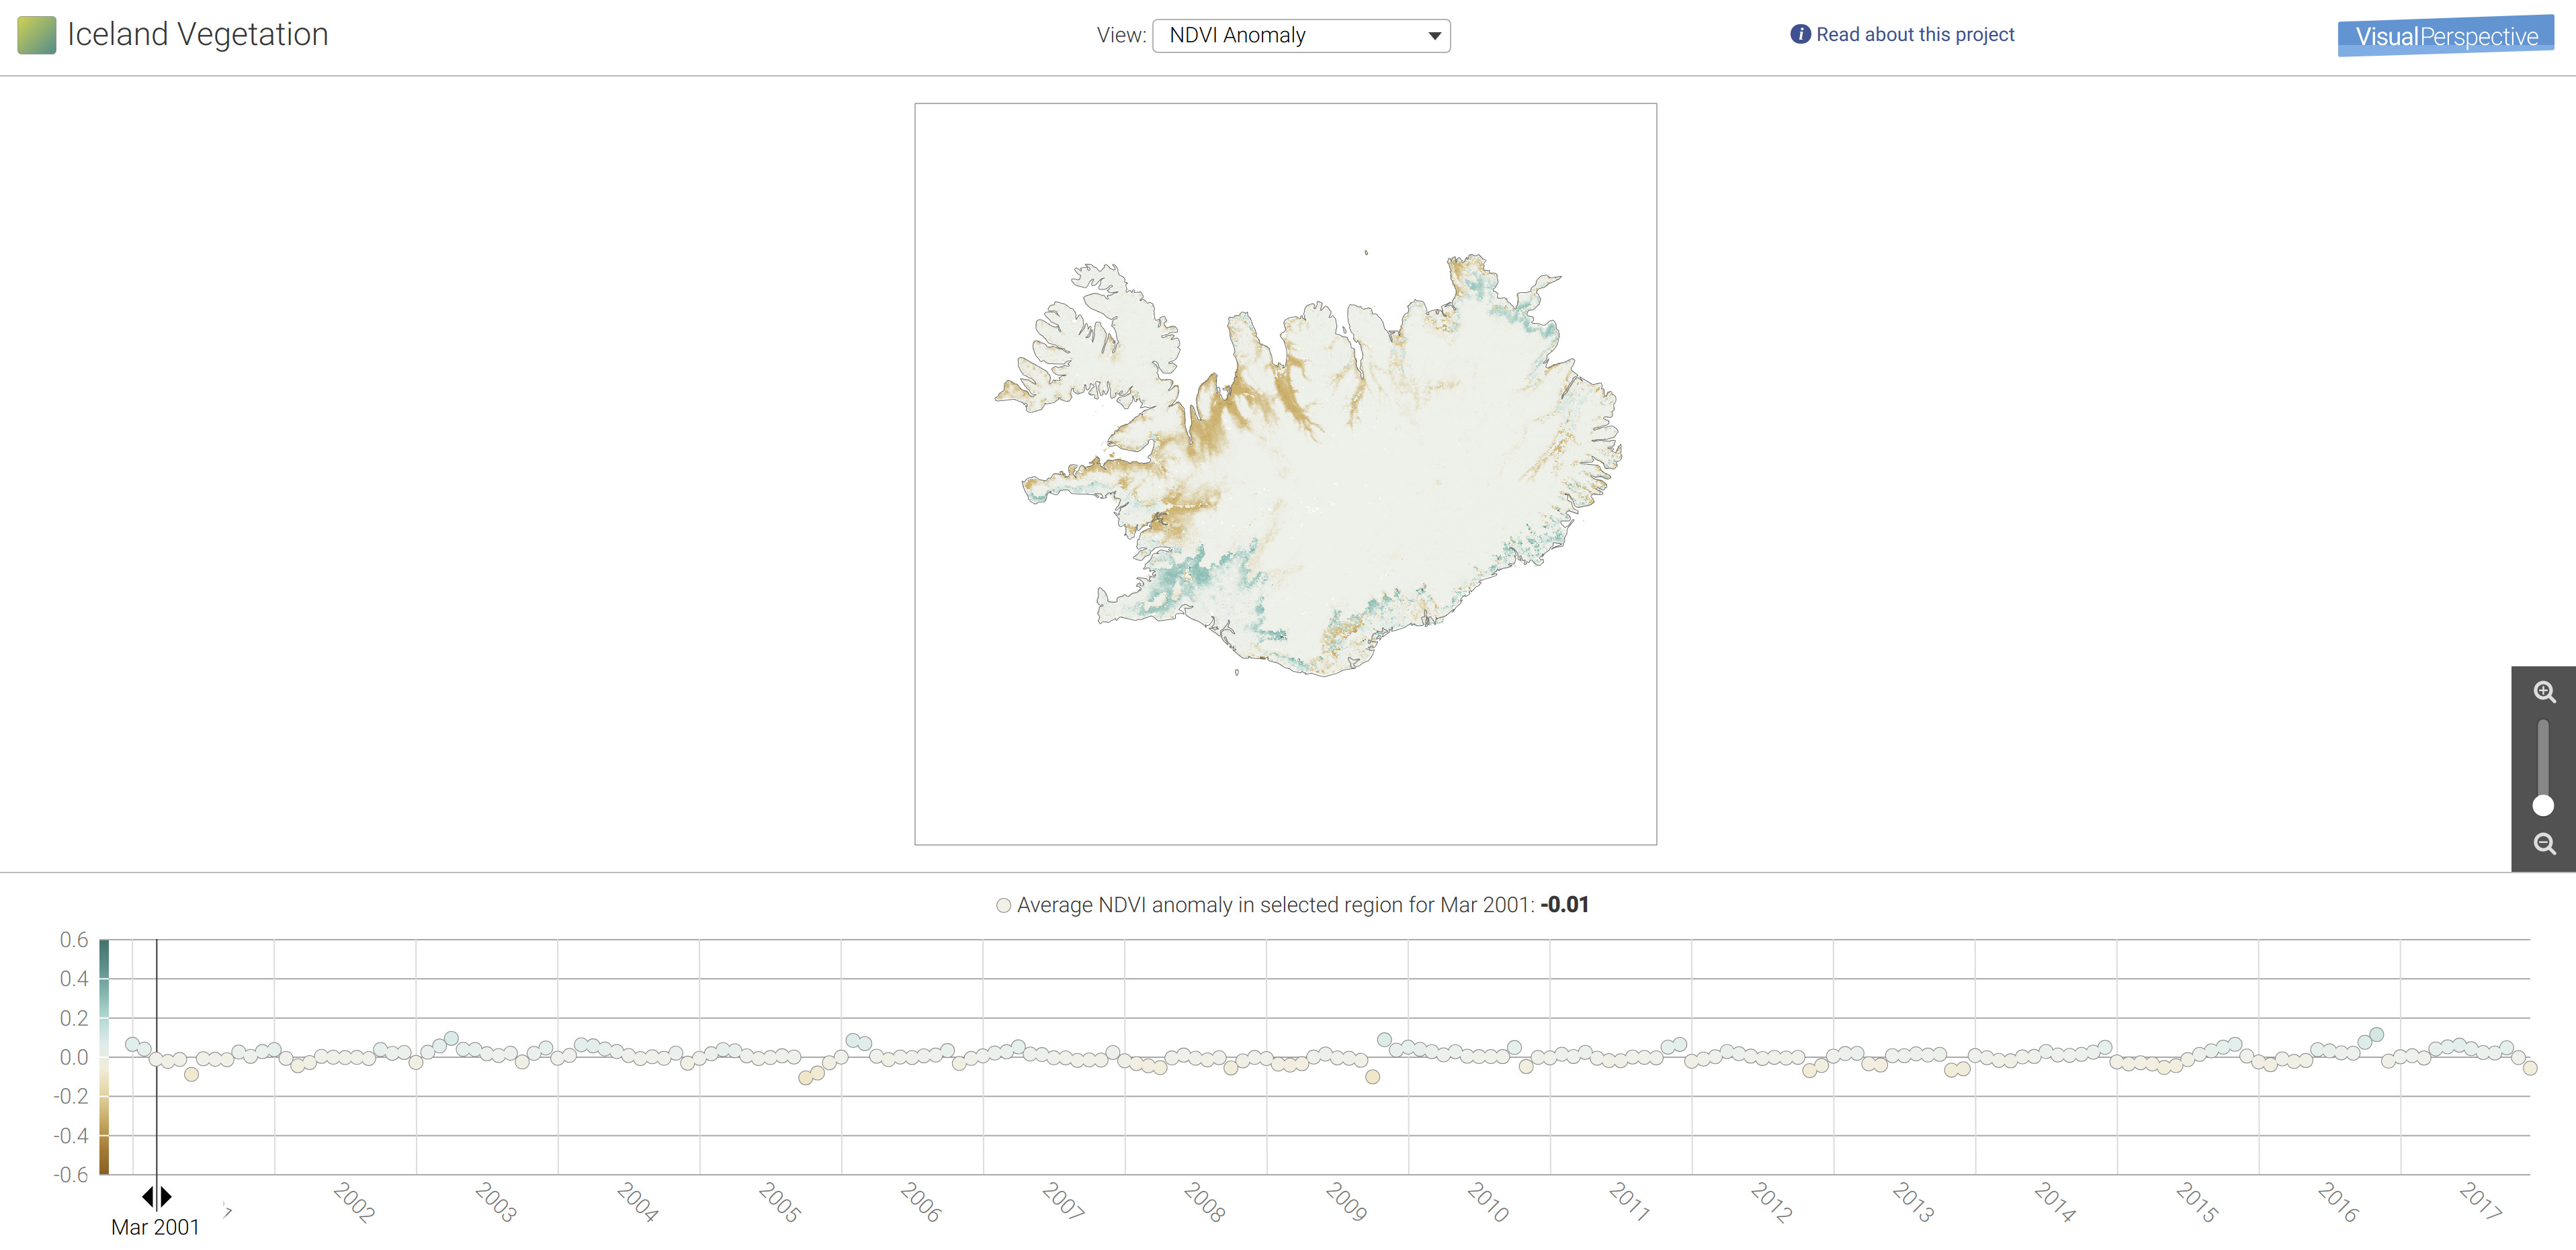
We recently introduced an open source web application, to explore the Normalized Difference Vegetation Index (NDVI) over space and time for Iceland (https://iceland.visualperspective.io). From this application, we were able to observe the impact of the Hálslón Reservoir on surrounding land. This was observed by viewing NDVI over several years of the same month. An easier way to observe this kind of change is through something called NDVI anomaly. The ability to view the NDVI anomaly over space and time for Iceland (Figure 1) has been added to the viewer.
What is NDVI Anomaly?
In our previous blog post (https://visualperspective.io/blog/iceland-ndvi-viewer) we discussed how NDVI is calculated and what it represents. This is a short blog post which covers how NDVI anomaly is calculated and what it represents.
Monthly NDVI anomaly is the difference between the average NDVI for a particular month of a given year and the average NDVI for the same month over a specified number of years (in this case, 2001-2017). Monthly NDVI anomaly tells us the health of vegetation for a particular month and year relative to what is considered normal (the mean) for that month. Positive NDVI anomalies represent healthier vegetation than the long term mean. This can be due to increased rainfall, for example. Negative NDVI anomalies represent reduced or less healthy vegetation compared to the long term mean. This can be due to factors such as less than average rainfall or removal of vegetation.
What is NDVI Anomaly Used For?
Since the NDVI anomaly is a comparison of the current month to the long term average, it can be a good indication of drought, deforestation, reforestation or general decline/increase in vegetation health.
Using NDVI anomalies along with indices of the El Niño Southern Oscillation, researchers (Liu and Juárez, 2010) were able to construct several models to predict the onset of drought in Northeast Brazil. In addition to predictive analysis, NDVI anomalies have been used to explain or correlate with recent events, such as severe 2010 drought in Amazon region. Others (Xu et al. 2011), showed significant correlations between NDVI anomalies and the 2010 drought which impacted nearly the entire tropical region of South America south of the equator.
Interestingly, NDVI anomalies along with other environmental indicators were used to predict an increase in Rift Valley fever for the Horn of Africa (Anyamba et al., 2008).
These are just a few examples of how NDVI anomalies are used to predict or explain vegetative health or factors correlated with vegetative health.
NDVI Anomaly in Visual Perspective’s Viewer
The viewer for NDVI anomaly has the same functionality as the regular NDVI. The top image shows the spatial values of NDVI anomaly over Iceland for a particular month as indicated by the vertical line in the lower time-series graph. This line can be moved through time by left clicking on it and dragging it across the time series. As the line moves across the time series, the top spatial plot is updated with the corresponding month.
Although the current view includes all of Iceland, you can select a smaller spatial portion by using the zoom feature on the lower right-hand side of the image. You can also move the spatial image around to select different zoomed regions. Zooming and moving the spatial image around will automatically update the time series so the data points represent the currently selected view. In addition, mouse scrolling and left click will act to zoom and pan respectively.
In addition to the default time-series view, you can group the NDVI anomaly values by month by selecting ‘NDVI Anomaly by month’ in the top drop down box. With this view you can get a sense of how NDVI anomaly changes over years for a particular month.
For animations demonstrating these features check out our previous blog post here.
NDVI Anomalies in Iceland
Lupines
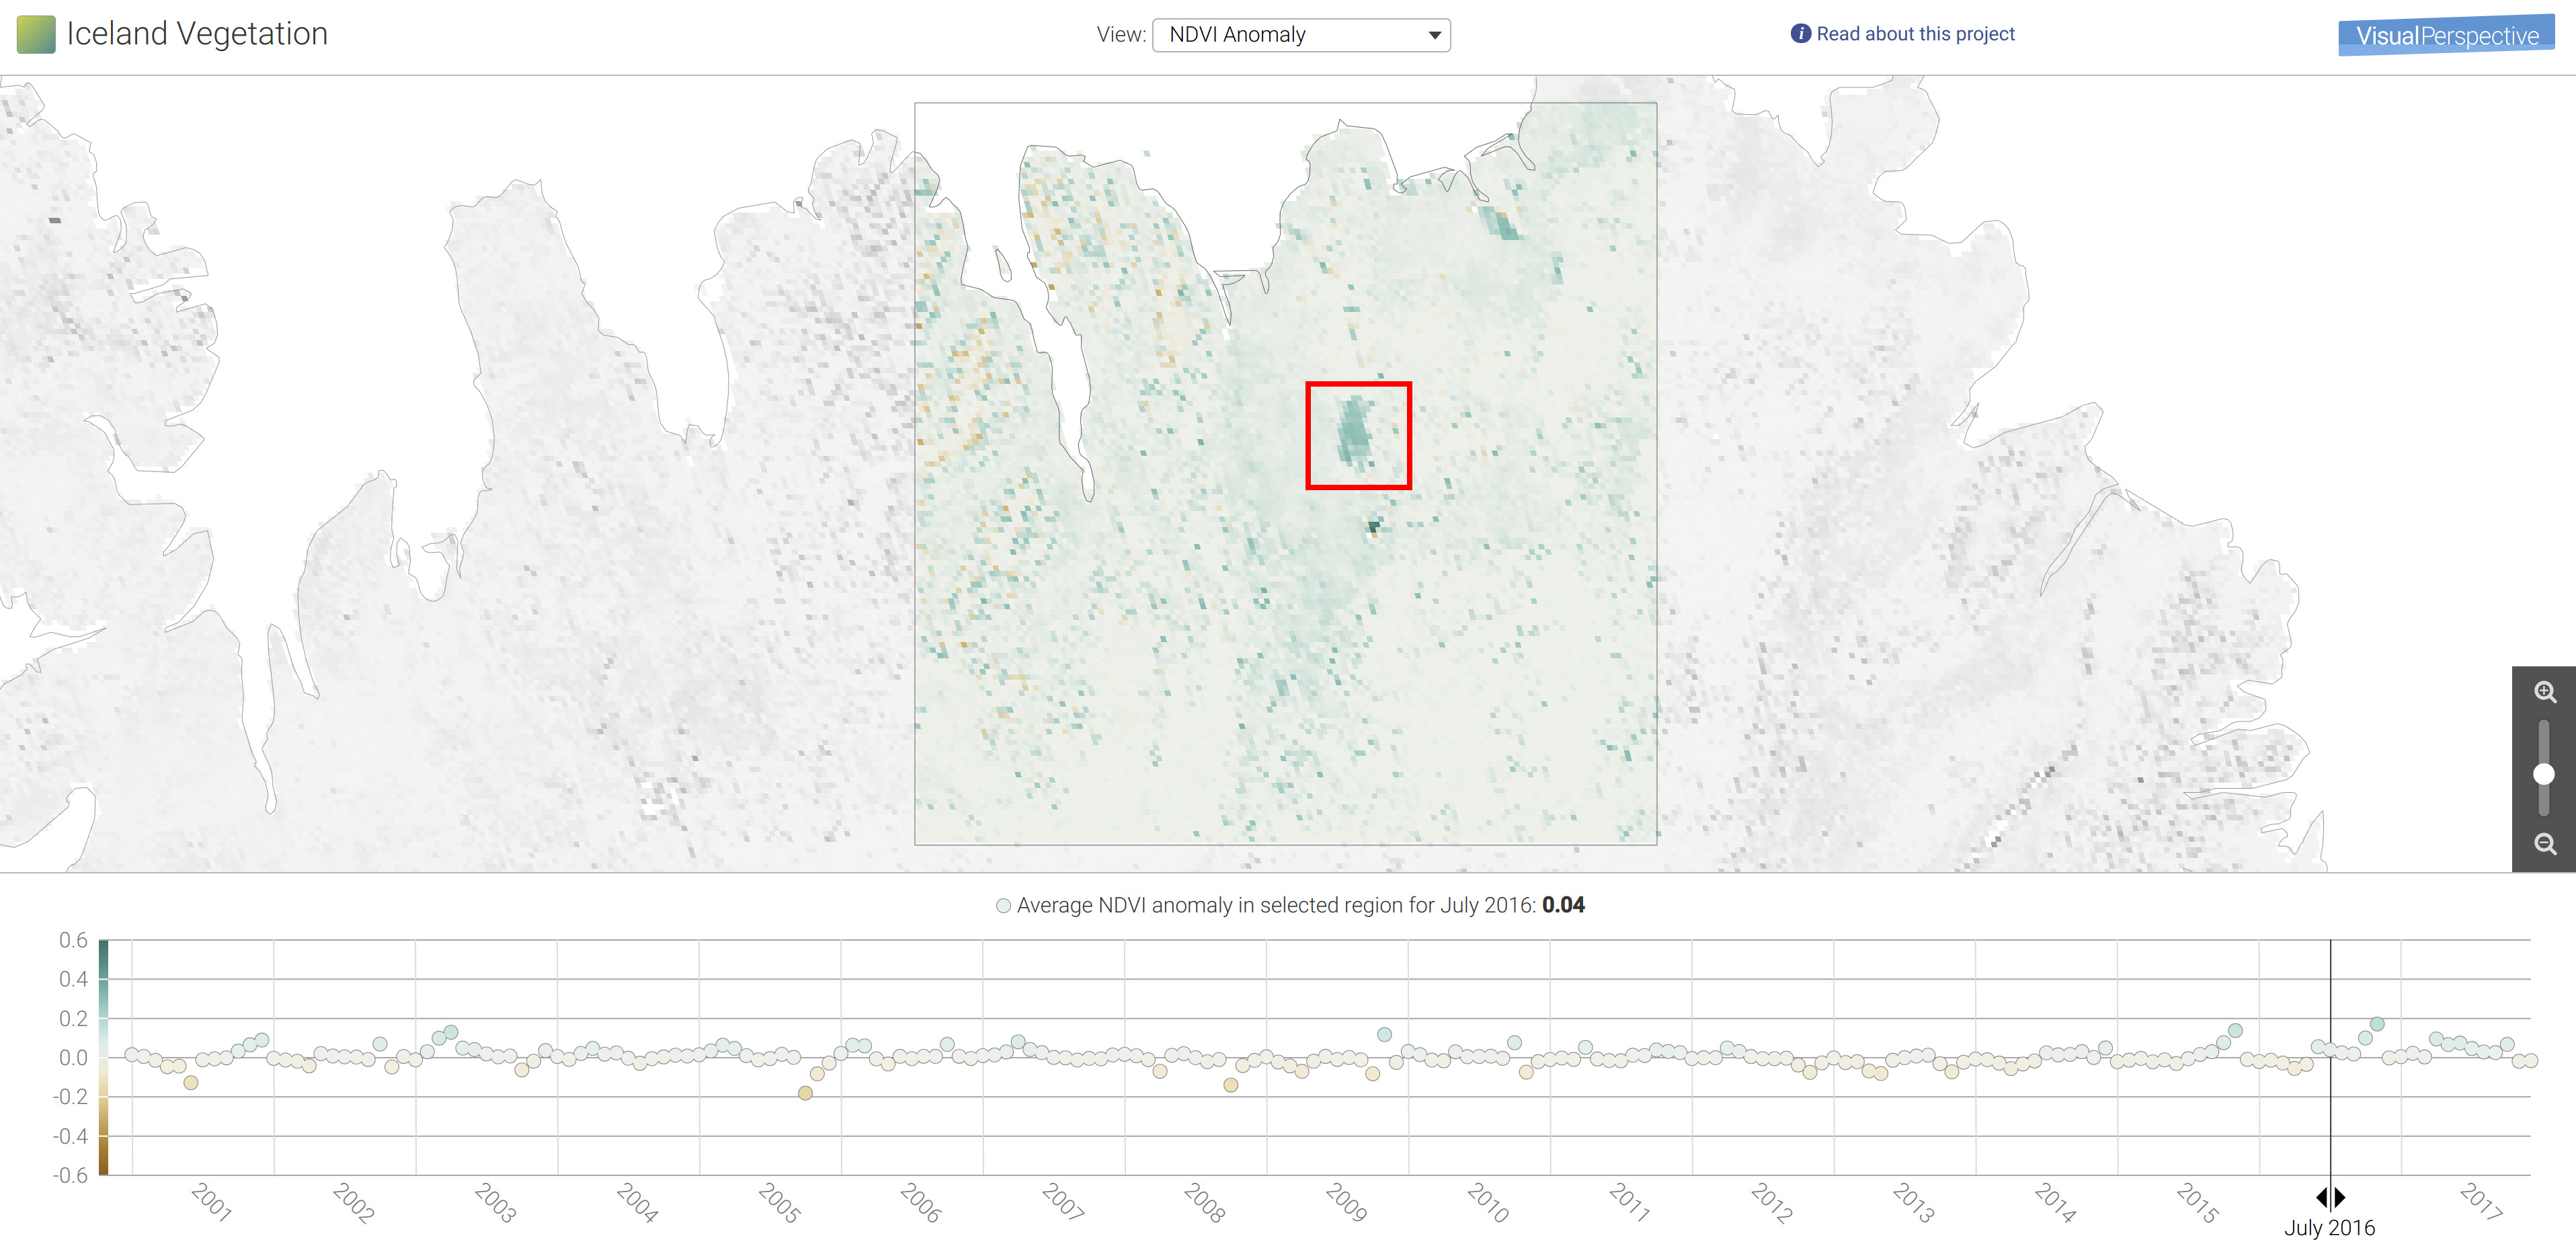
Did you ever think you could see the effects of a re-vegetation project from space? A significant re-vegetation project in the Hólasandur area of northeastern Iceland can be seen through NDVI anomaly (Figure 2). This project was carried out by the local conservation group Húsgull and the Soil Conservation Service of Iceland. It involved extensive seeding of Lupines (Miss Rumphius?) in the Holasandur desert between Husavik and Lake Myvatn. It is believed that Iceland has lost significant amounts of vegetation after settlement in the early 12th century leading to erosion and desertification across the country (Vésteinsson et al, 2002). Lupines were chosen over more traditional grass and fertilizers due to the cost and size of the project. However, recently local views are changing on the seeding of Lupines in Iceland. The invasive Lupine species is now threatening native Icelandic plants and various control techniques have been implemented to help prevent it’s spreading.
Hálslón Reservoir
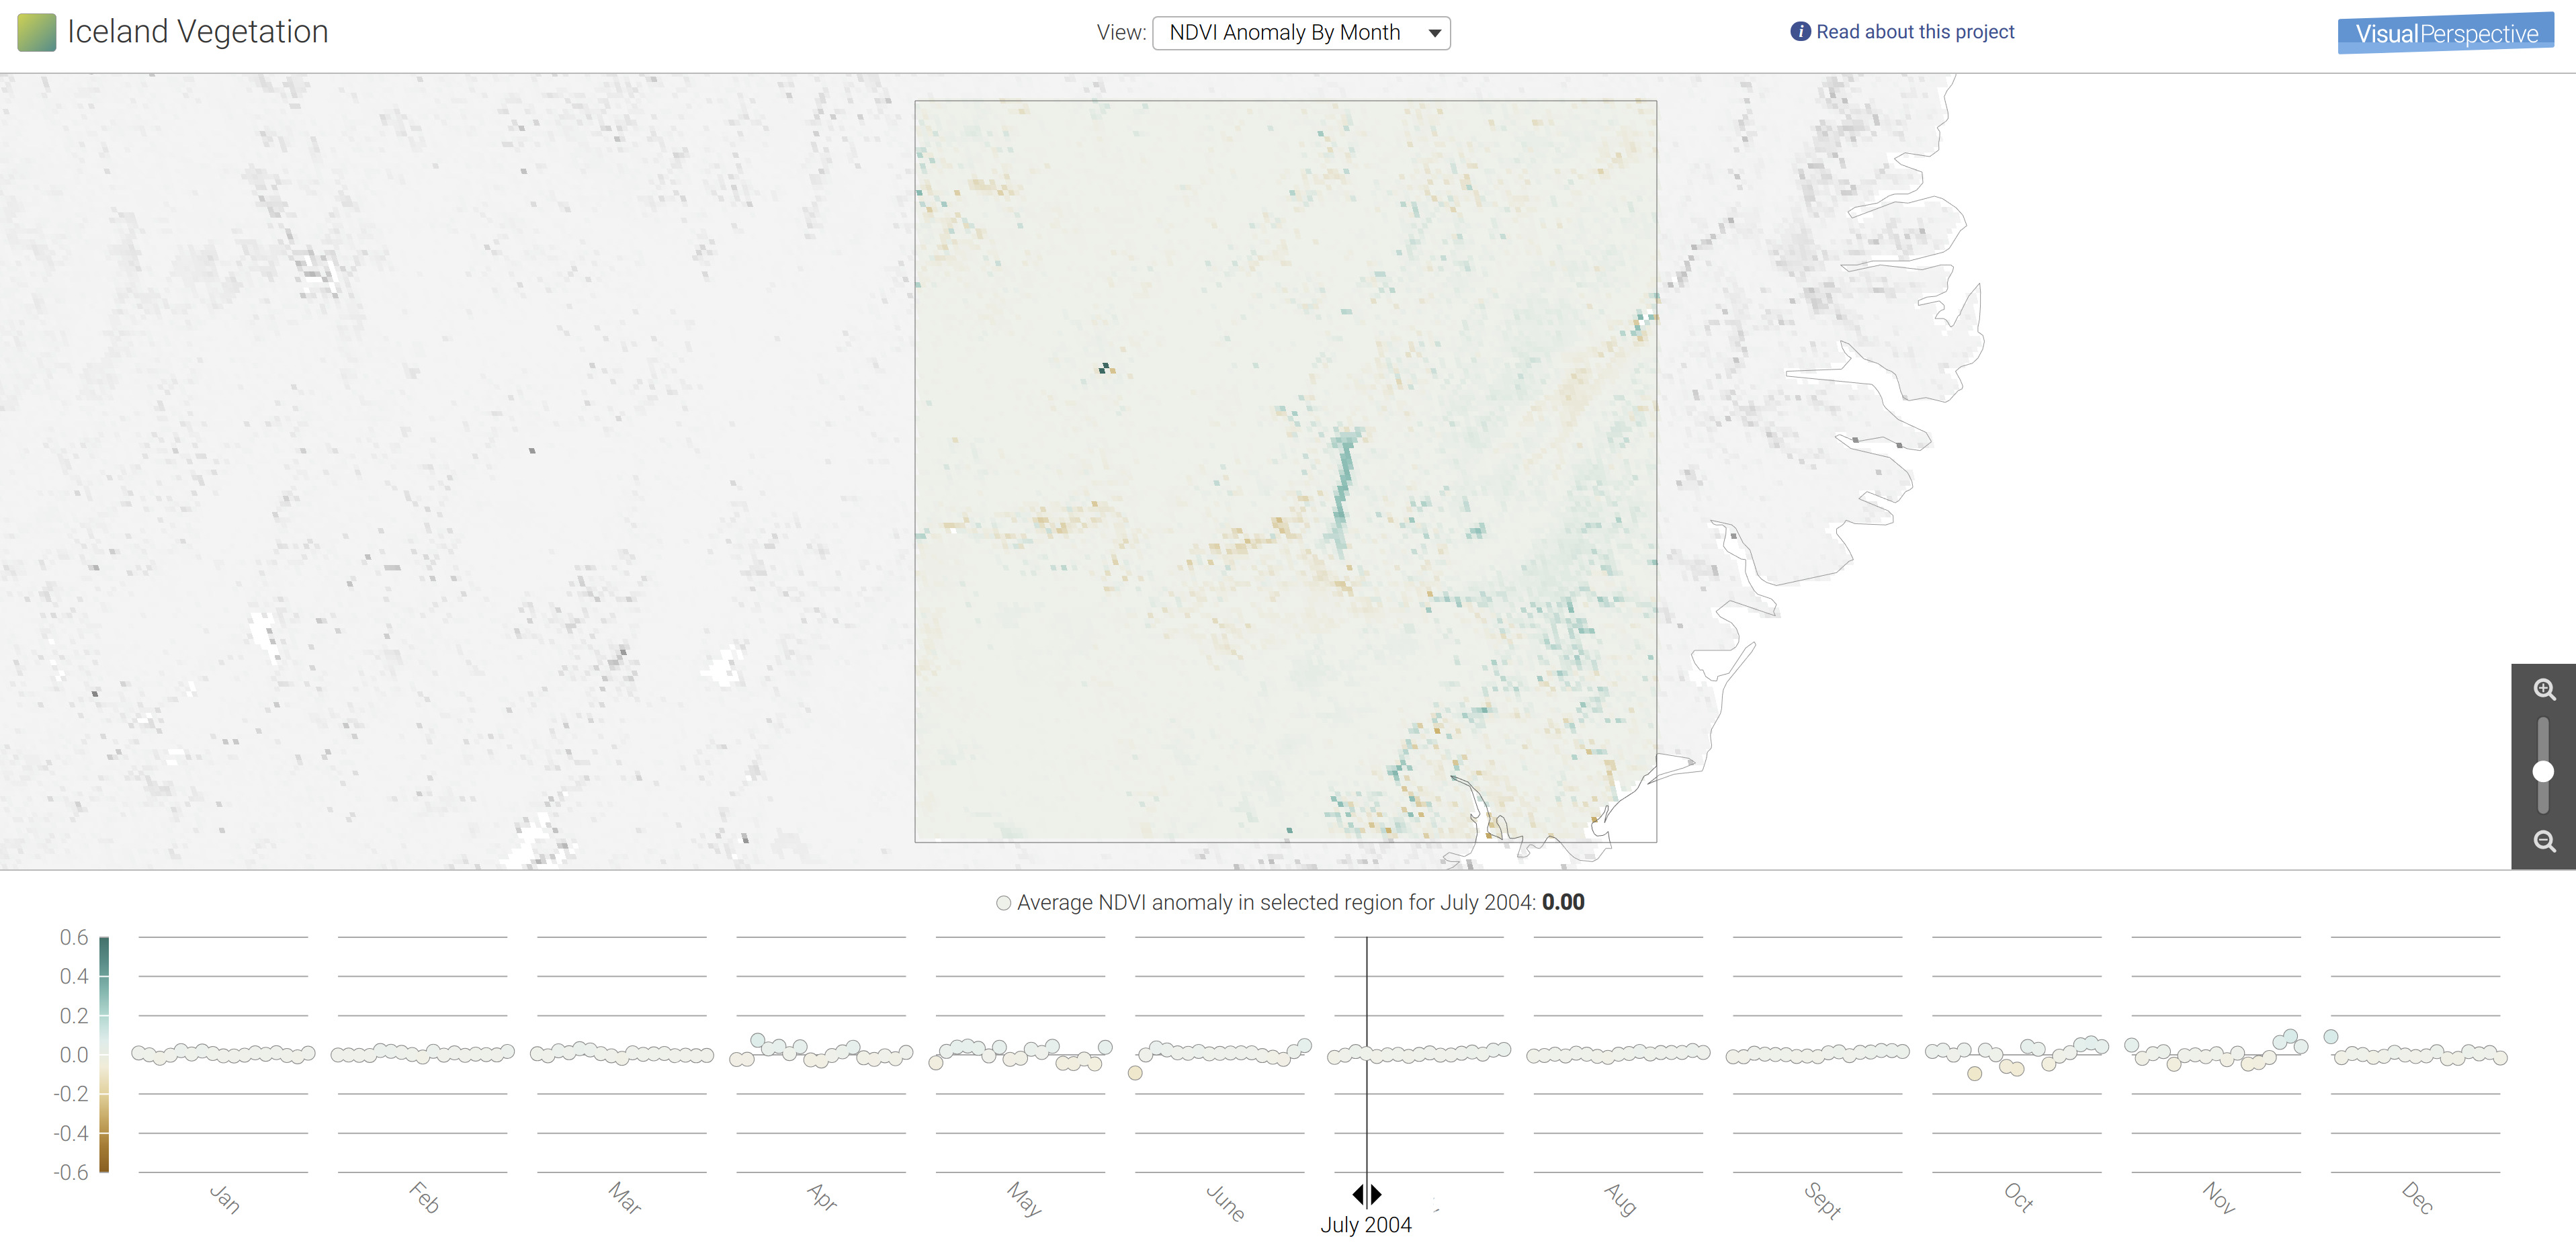
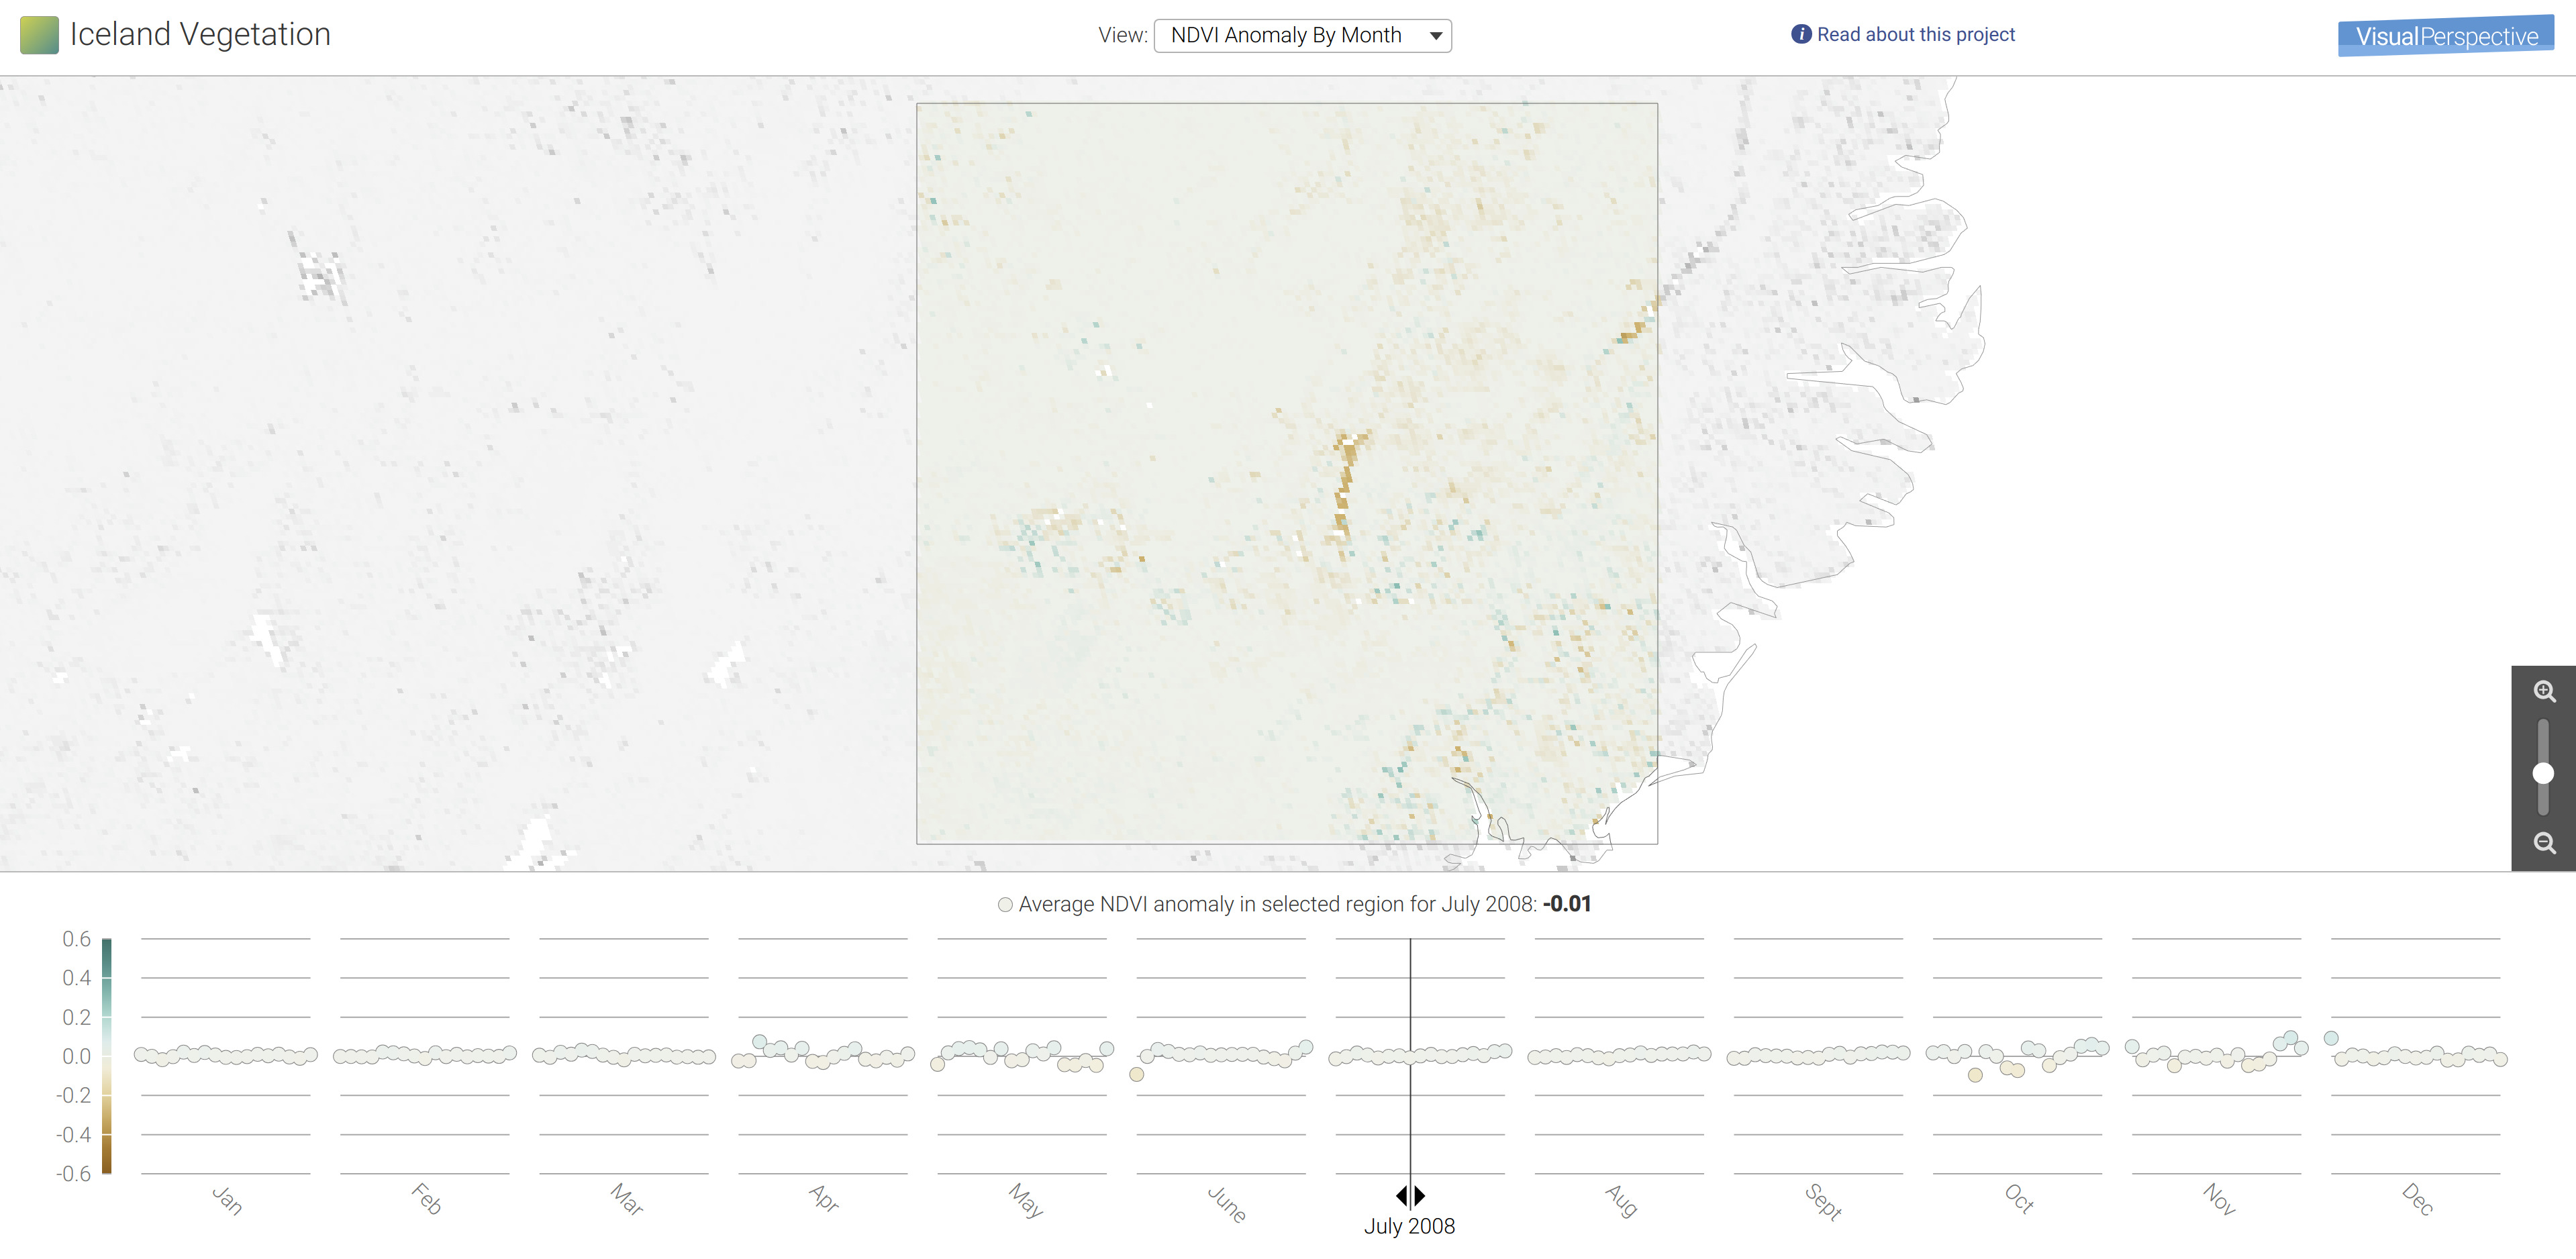
As mentioned in our previous blog post, the filling of the Hálslón Reservoir (2006) created a clearly visible signature in NDVI. The Hálslón Reservoir can also be clearly seen in the NDVI anomaly data. With NDVI anomaly, the signature of this man-made reservoir can be seen before construction started on the reservoir. Figure 3 shows the NDVI anomaly prior to construction (July 2004) and Figure 4 shows the NDVI anomaly after construction (July 2008). It makes sense that we see a negative NDVI anomaly after construction, in Figure 4, due to the loss of vegetation from the filling of the reservoir. However, the positive anomaly present before the reservoir is filled is a little counter intuitive. The reservoir did not exist before it was built, so why does it appear in NDVI anomaly prior to construction? Keep in mind that the monthly anomaly for a particular year and month is calculated as the difference between the long term average (2001-2017) for that month minus the NDVI for that particular year and month. If there is a significant change in NDVI over a large enough period, this can skew the mean toward higher or lower values. In this case the filling of the Hálslón Reservoir skewed the overall mean NDVI for that area more negative. As a result, prior to the filling of the reservoir that area appears to have a positive NDVI anomaly signature.
As you can see, NDVI anomaly can be a helpful way to extract new insights from NDVI data. It can make changes more easily visible, though it also requires careful interpretation, as in the case of the positive anomaly we see before the construction of the reservoir.
How Can Visual Perspective Help You?
We hope you enjoy this blog post on NDVI anomalies in the context of Iceland. Our passion is to create meaningful visualization and understanding of data. Let us know how we can help you, contact us.
References
Anyamba, A., Chretien, J.P., Small, J., Tucker, C.J., Formenty, P.B., Richardson, J.H., Britch, S.C., Schnabel, D.C., Erickson, R.L. and Linthicum, K.J., 2009. Prediction of a Rift Valley fever outbreak. Proceedings of the National Academy of Sciences, pp.pnas-0806490106.
Liu, W.T. and Juárez, R.N., 2001. ENSO drought onset prediction in northeast Brazil using NDVI. International Journal of Remote Sensing, 22(17), pp.3483-3501.
Vésteinsson, O., McGovern, T.H. and Keller, C., 2002. Enduring impacts: social and environmental aspects of Viking Age settlement in Iceland and Greenland. Archaeologia islandica, 2, pp.98-136.
Xu, L., Samanta, A., Costa, M.H., Ganguly, S., Nemani, R.R. and Myneni, R.B., 2011. Widespread decline in greenness of Amazonian vegetation due to the 2010 drought. Geophysical Research Letters, 38(7).